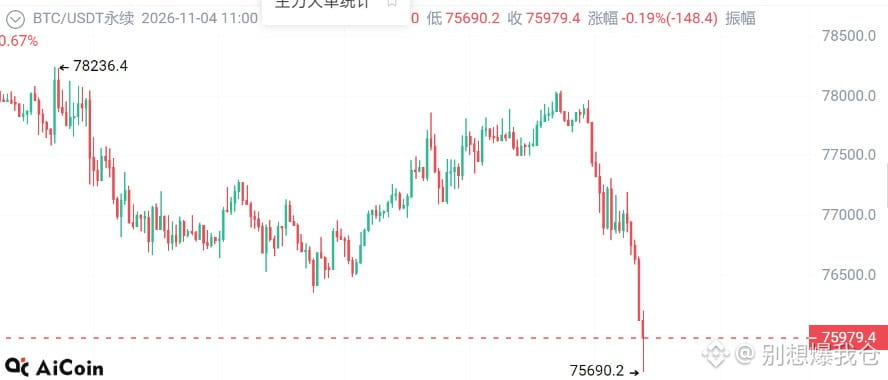
This move probably left quite a few bulls completely baffled.
Looking at the chart, Bitcoin (BTC) was still trading around 78,200 this morning, and everyone thought it was about to stabilize. But just after 11 a.m., the market put on a “high-dive” show, printing more than ten big bearish candles in a row with no sign of a rebound, and plunging straight through 75,700.
Faced with such a brutally sharp “Bart pattern” move, my head is full of questions, and I’d like to discuss them with you:
Question 1: Who exactly is dumping?
From a macro perspective, today is voting day in the U.S. midterm elections, and risk aversion is running high. On top of that, the Binance hack a few days ago triggered a massive outflow of funds, and bulls were already lacking confidence. But this drop was so rapid that it looks more like a large player deliberately dumping the market to liquidate highly leveraged longs.
Question 2: Is 75,700 the bottom?
On the 15-minute chart, the price formed a candle with a long lower wick around 75,690, suggesting there is some buying support here for now. However, the MACD histogram bars below are still growing, and the moving averages remain in a strong bearish alignment. The first rebound after a sharp drop is often the most dangerous and can easily turn into a “bear flag” continuation.
Question 3: If it were you, would you dare to buy the dip now?
My view: stay away. Until we see a clear high-volume reversal signal or price climbs back above 77,000, any attempt to buy the dip is like “catching a falling knife.”
Current strategy: Since the trend has already broken down, don’t try to guess the bottom. Stay out and watch; wait for the price to form a pattern as it consolidates around this level, or see how sentiment develops after the U.S. stock market opens.
Do you think this crash is a shakeout by the big players, or is a major collapse really underway?
#行情 analysis #BTC走势分析 TC #技术分析参考 analysis #contract #交易日记
Looking at the chart, Bitcoin (BTC) was still trading around 78,200 this morning, and everyone thought it was about to stabilize. But just after 11 a.m., the market put on a “high-dive” show, printing more than ten big bearish candles in a row with no sign of a rebound, and plunging straight through 75,700.
Faced with such a brutally sharp “Bart pattern” move, my head is full of questions, and I’d like to discuss them with you:
Question 1: Who exactly is dumping?
From a macro perspective, today is voting day in the U.S. midterm elections, and risk aversion is running high. On top of that, the Binance hack a few days ago triggered a massive outflow of funds, and bulls were already lacking confidence. But this drop was so rapid that it looks more like a large player deliberately dumping the market to liquidate highly leveraged longs.
Question 2: Is 75,700 the bottom?
On the 15-minute chart, the price formed a candle with a long lower wick around 75,690, suggesting there is some buying support here for now. However, the MACD histogram bars below are still growing, and the moving averages remain in a strong bearish alignment. The first rebound after a sharp drop is often the most dangerous and can easily turn into a “bear flag” continuation.
Question 3: If it were you, would you dare to buy the dip now?
My view: stay away. Until we see a clear high-volume reversal signal or price climbs back above 77,000, any attempt to buy the dip is like “catching a falling knife.”
Current strategy: Since the trend has already broken down, don’t try to guess the bottom. Stay out and watch; wait for the price to form a pattern as it consolidates around this level, or see how sentiment develops after the U.S. stock market opens.
Do you think this crash is a shakeout by the big players, or is a major collapse really underway?
#行情 analysis #BTC走势分析 TC #技术分析参考 analysis #contract #交易日记