


By the end, I’d rather test myself with a question like this: Given a chart with no conclusions drawn on it, can I clearly explain how I read the situation, what evidence I’m relying on, what I plan to do, and what changes would make me abandon my original plan?
In this lesson, join me in putting together a chart-reading log. At each checkpoint, write down four things: which part of the chart I’m assessing, what evidence matters most, what I plan to do now, and what changes would invalidate the plan. First, study the chart and write down your own assessment; then compare it with the analysis below; finally, check it against what happens next in the market.
Start with the BTC chart below: which side—buyers or sellers—has made more progress? What, if anything, have the last few rebound candles changed?
This is a teaching example selected in hindsight, not a blind test or a real-time forecast. Throughout, the charts show Binance BTCUSDT USDⓈ-M perpetual trade-price candles, four hours per candle, with all times in UTC+8. Volume bars show the amount of BTC traded, not net inflows. Green candles are bullish and red candles are bearish. Each analysis chart shows only candles that had closed by its stated cutoff.
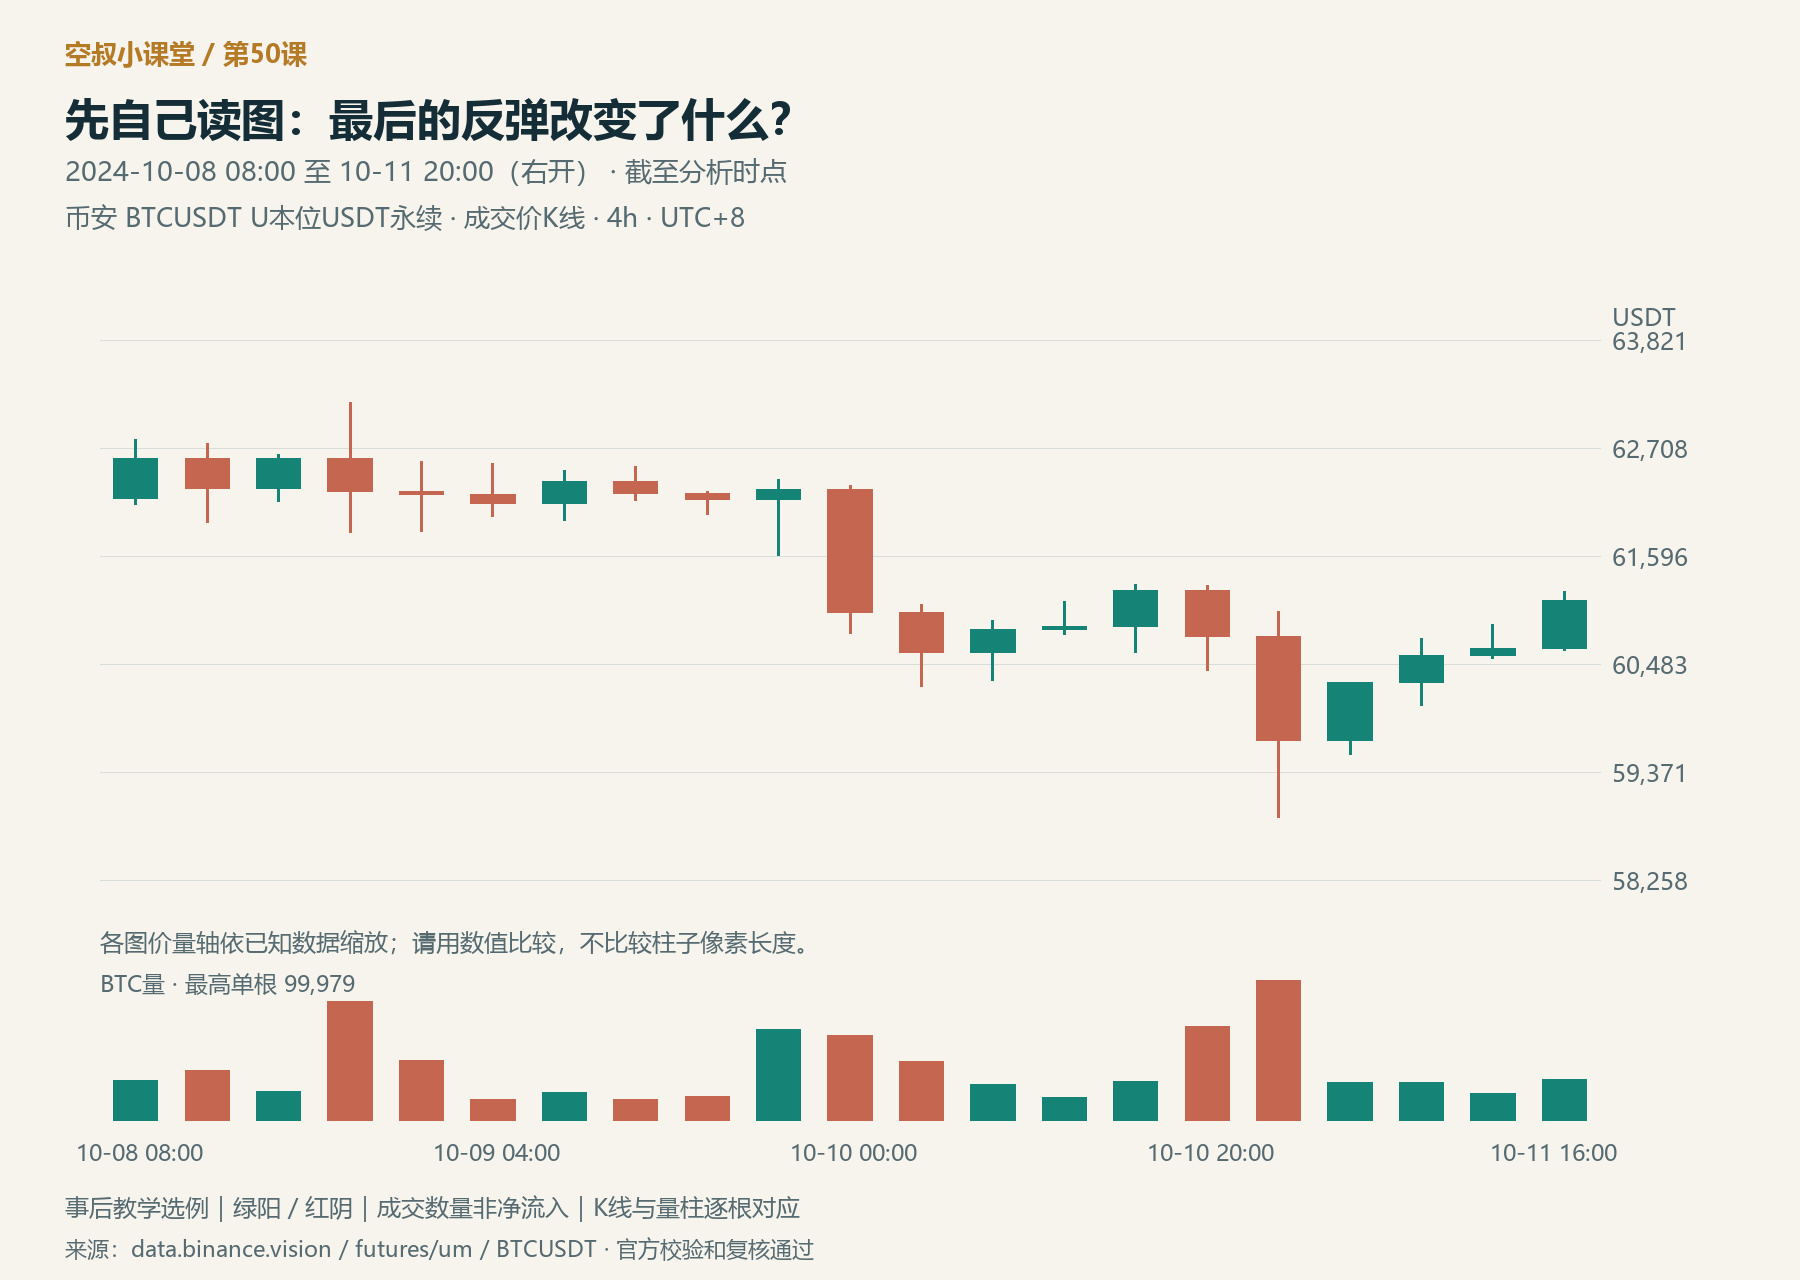
Figure 1 | Read the chart yourself first: October 8, 2024, 08:00 to October 11, 20:00. The final candle closes at 19:59:59.999. For now, do not label any chart patterns.
First, define the scope: which part of the price action am I judging?
As of 20:00 on October 11, this 4-hour price action had repeatedly moved lower. The October 10 rebound did not prevent a new low, and the candle at 00:00 on the 11th reached 58,900. Price then recovered, with the final candle rising from 60,643.2 to 61,140, showing that demand did respond at lower levels.
My main judgment is that the decline is being repaired, but for now this is still a rebound after a decline; price has not yet reclaimed the starting point of the previous key downward move. This statement applies only to the 4-hour range shown on the chart. It cannot be used to declare that BTC’s entire major trend has reversed.
Why not simply say, “The bottom is in”? The high of the bearish candle at 00:00 on October 10 was 62,320, and price then kept falling. This is a meaningful level in the current analysis: if the rebound cannot overcome even the starting point of that downward move, the damage caused by selling pressure has not yet been repaired. Here, we use it as a resistance reference to test. Resistance is an area where upward moves previously met pressure, not a wall that guarantees a fall whenever price touches it.
The rebound from the low is real; concluding that the trend has reversed is a much broader claim. Accumulation describes a process in which price goes through preparation and testing, supply weakens, and demand gains the upper hand. A few bullish candles alone are not enough to fill in that entire process.
Spring—a “shakeout and rebound” in which price breaks below established support and quickly returns above it—also needs to be assessed in context, including supply during the break and the test that follows. Support is an area where a previous decline found buyers. Here, price is still in a repair phase after downward pressure; a bounce from 58,900 is not enough to justify labeling it a “successful Spring” and saying it is time to buy.
So, at this point, the action is to wait and see whether the rebound can overcome 62,320, then check whether a pullback gives back the progress just made. If price falls below 58,900 again, the hypothesis of a recovery from this low should be abandoned. This is not vague waiting for the market; it is waiting for a specific piece of new evidence.
When new evidence appears, advance the judgment only as far as it supports
Now extend the chart to 16:00 on October 12.
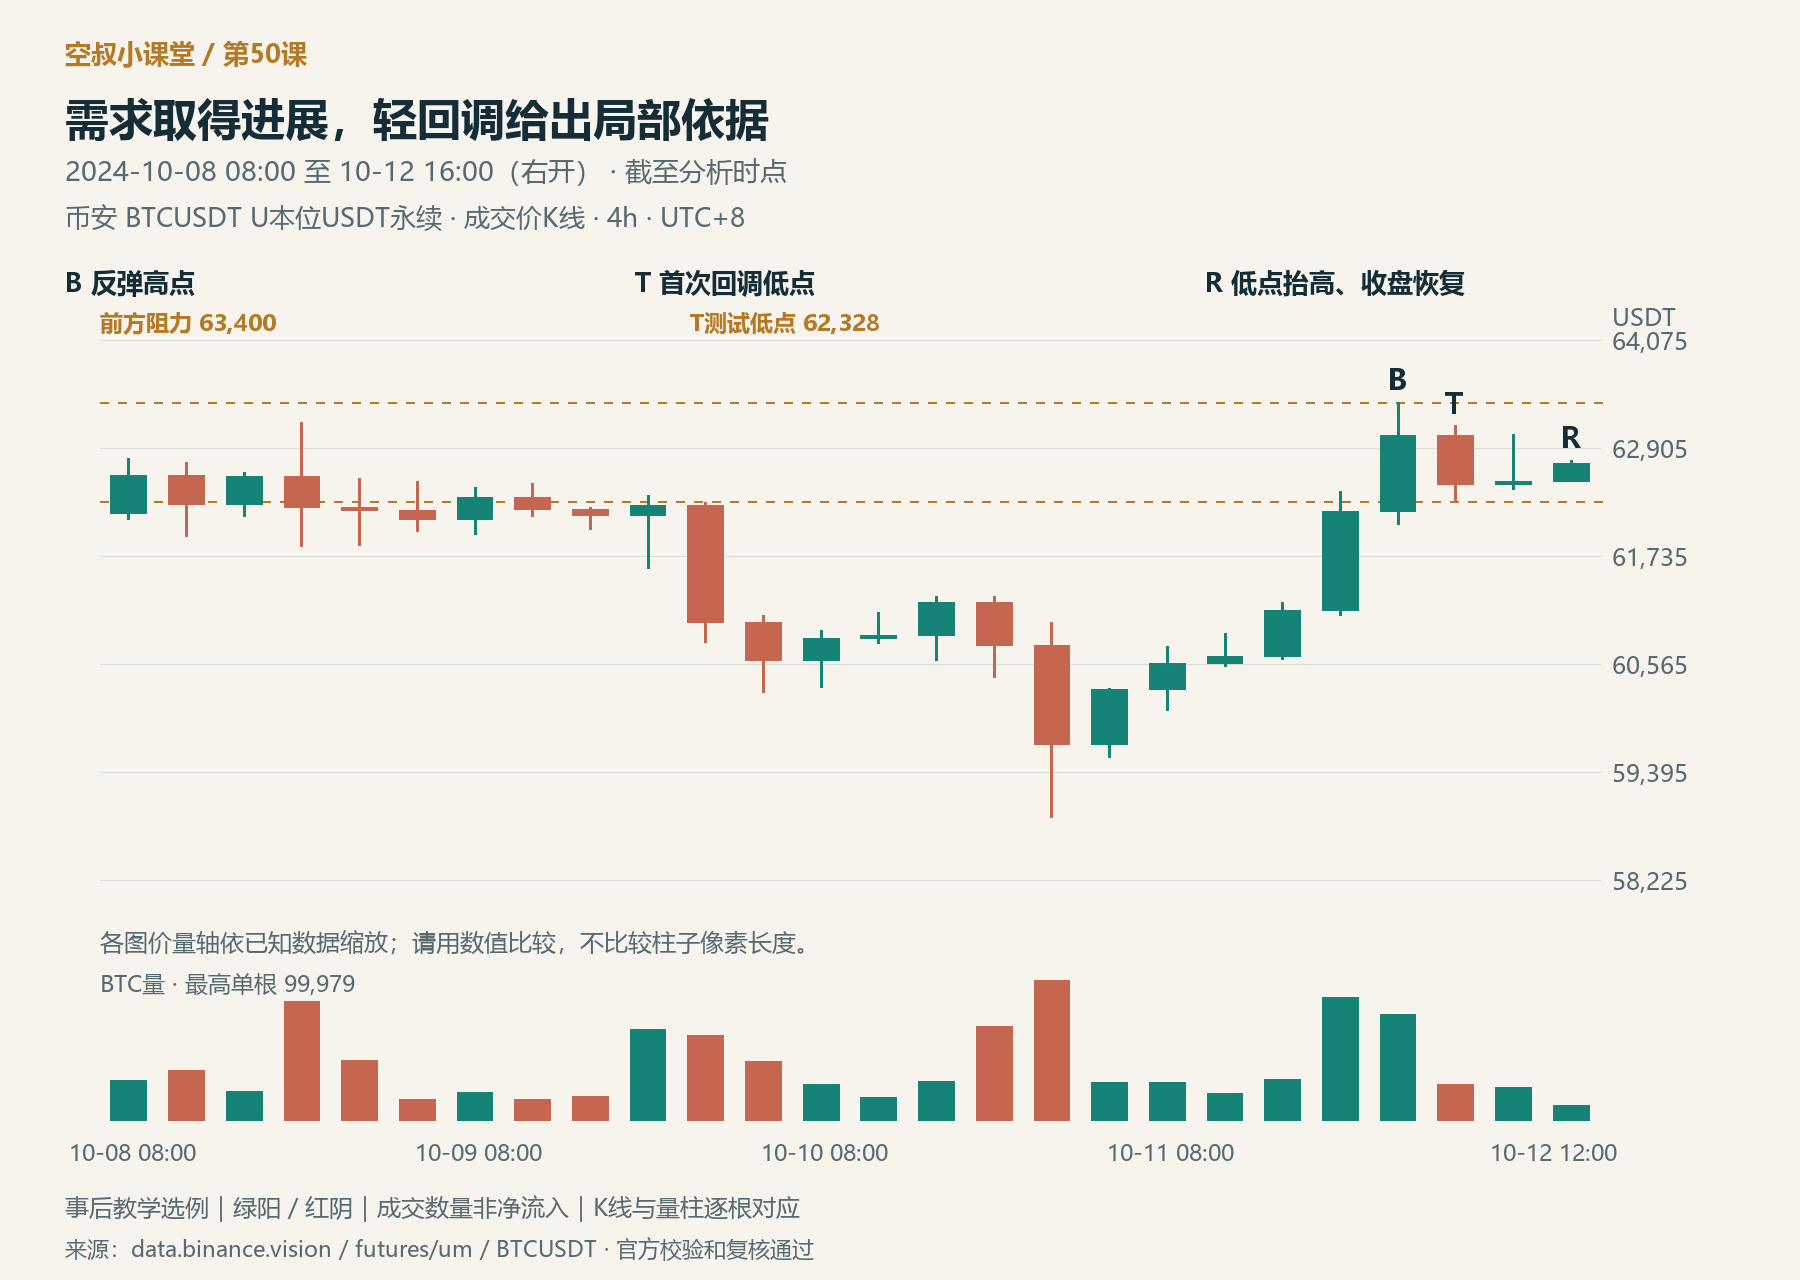
Figure 2 | Demand advances, followed by a shallow pullback: B marks the high after price moved above the previous downward-move starting point; T marks the low of the first pullback; R marks the recovery at this cutoff. The letters are labels for this chart only.
Two consecutive bullish candles at 20:00 on the 11th and 00:00 on the 12th pushed price higher, with volumes of about 87,800 and 75,700 BTC, respectively. The second candle reached a high of 63,400 and closed at 63,042.4, moving above 62,320. The significance of demand is not simply that “a big bullish candle appeared,” but that price crossed the level that had previously driven it lower.
Next, look at the pullback. The volumes of the candles at 04:00, 08:00, and 12:00 on the 12th were about 25,500, 23,200, and 10,100 BTC, respectively; their lows were 62,328, 62,458, and 62,537, and the last closed at 62,734.1. The first candle did give back some of the rise, but the next candles did not extend the decline; instead, the lows moved higher.
Taken together, the upward move crossed the starting point of the previous downward move, the pullback came on lower volume with higher lows, and R closed bullish. As of Figure 2, the local repair in this segment is holding, supply is weakening during the pullback, and R’s closing recovery provides the participation signal used in this lesson. There is no need to wait for a break above 63,400 before recognizing that there is a basis for a bullish trade at this point.
This applies the method from the first integrated-analysis example by Meng Hongtao: first, use the demand and test already observed to form a participation plan, then watch for subsequent follow-through as expected. Follow-through tests the rationale for participating; it does not mean waiting for every confirmation before making a judgment. We borrow this sequence; the specific BTC levels and handling are compiled for this series.
Why choose R instead of buying as soon as the first big bullish candle appears? Because by this point there has been a pullback test: the first decline stopped at T, the next two candles did not push lower, and the final R made a higher low and closed with a recovery. The basis for participating is the combination of “demand advance—weakening pullback—recovery,” not the color of the R candle alone. Weakening supply is an interpretation of volume and price; it does not prove that institutions have completed accumulation.
This teaching plan uses an approach of participating after R closes, at the current pullback area. Using the 62,734.1 closing price at the cutoff as a reference, participation based on this local rationale is possible if the actual quote is still around this level, T has not been broken, and the potential loss at the preselected stop is affordable. This is not a signal that still needs to wait for some unspecified confirmation, and it does not assume that an order could necessarily be filled at that closing price.
T at 62,328 is the price boundary for this rationale; B at 63,400 is the first resistance. The former comes from the newly formed test low and is slightly above the previous downward-move starting point at 62,320; an 8-dollar difference does not imply special precision. The distance from 62,734.1 to T is 406.1, and to B it is 665.9. Comparing the two distances helps assess the entry location; they are not guaranteed profits or a verified risk-reward ratio.
If the actual quote is already close to 63,400, the remaining upside is smaller while the distance to invalidation is greater. Skip chasing this entry and wait for a new pullback and a new rationale. If the potential loss at the current stop is unaffordable, do not force a trade. A valid directional judgment does not mean every quote is worth buying.
If you participate, the next expectation is that demand will challenge 63,400 and preserve the gains from the upward move. If price is repeatedly rejected at resistance and the pullback deepens, reassess the rationale for holding. Set the firmest condition in advance: if you have not entered and price first falls below 62,328, cancel the plan; if you have entered on this basis, exit when price breaks below that level—do not wait for the 4-hour candle to close, for volume to rise, or for a rebound. If a preset price stop is triggered sooner, execute the stop first. This example does not assume any actual orders, position sizes, or fills.
By this cutoff, we can write a complete record: the scope is the 4-hour repair in this segment; the rationale is the shallow pullback and recovery following the advance in demand; the action is to participate at the current level subject to risk conditions, not to chase near resistance; invalidation is a break below the test low. Before revealing the rest of the price action, try writing your own four sentences.
When the outcome starts to go against you, the plan is truly put to the test
Stop first at 00:00 on October 14; do not look any further ahead.
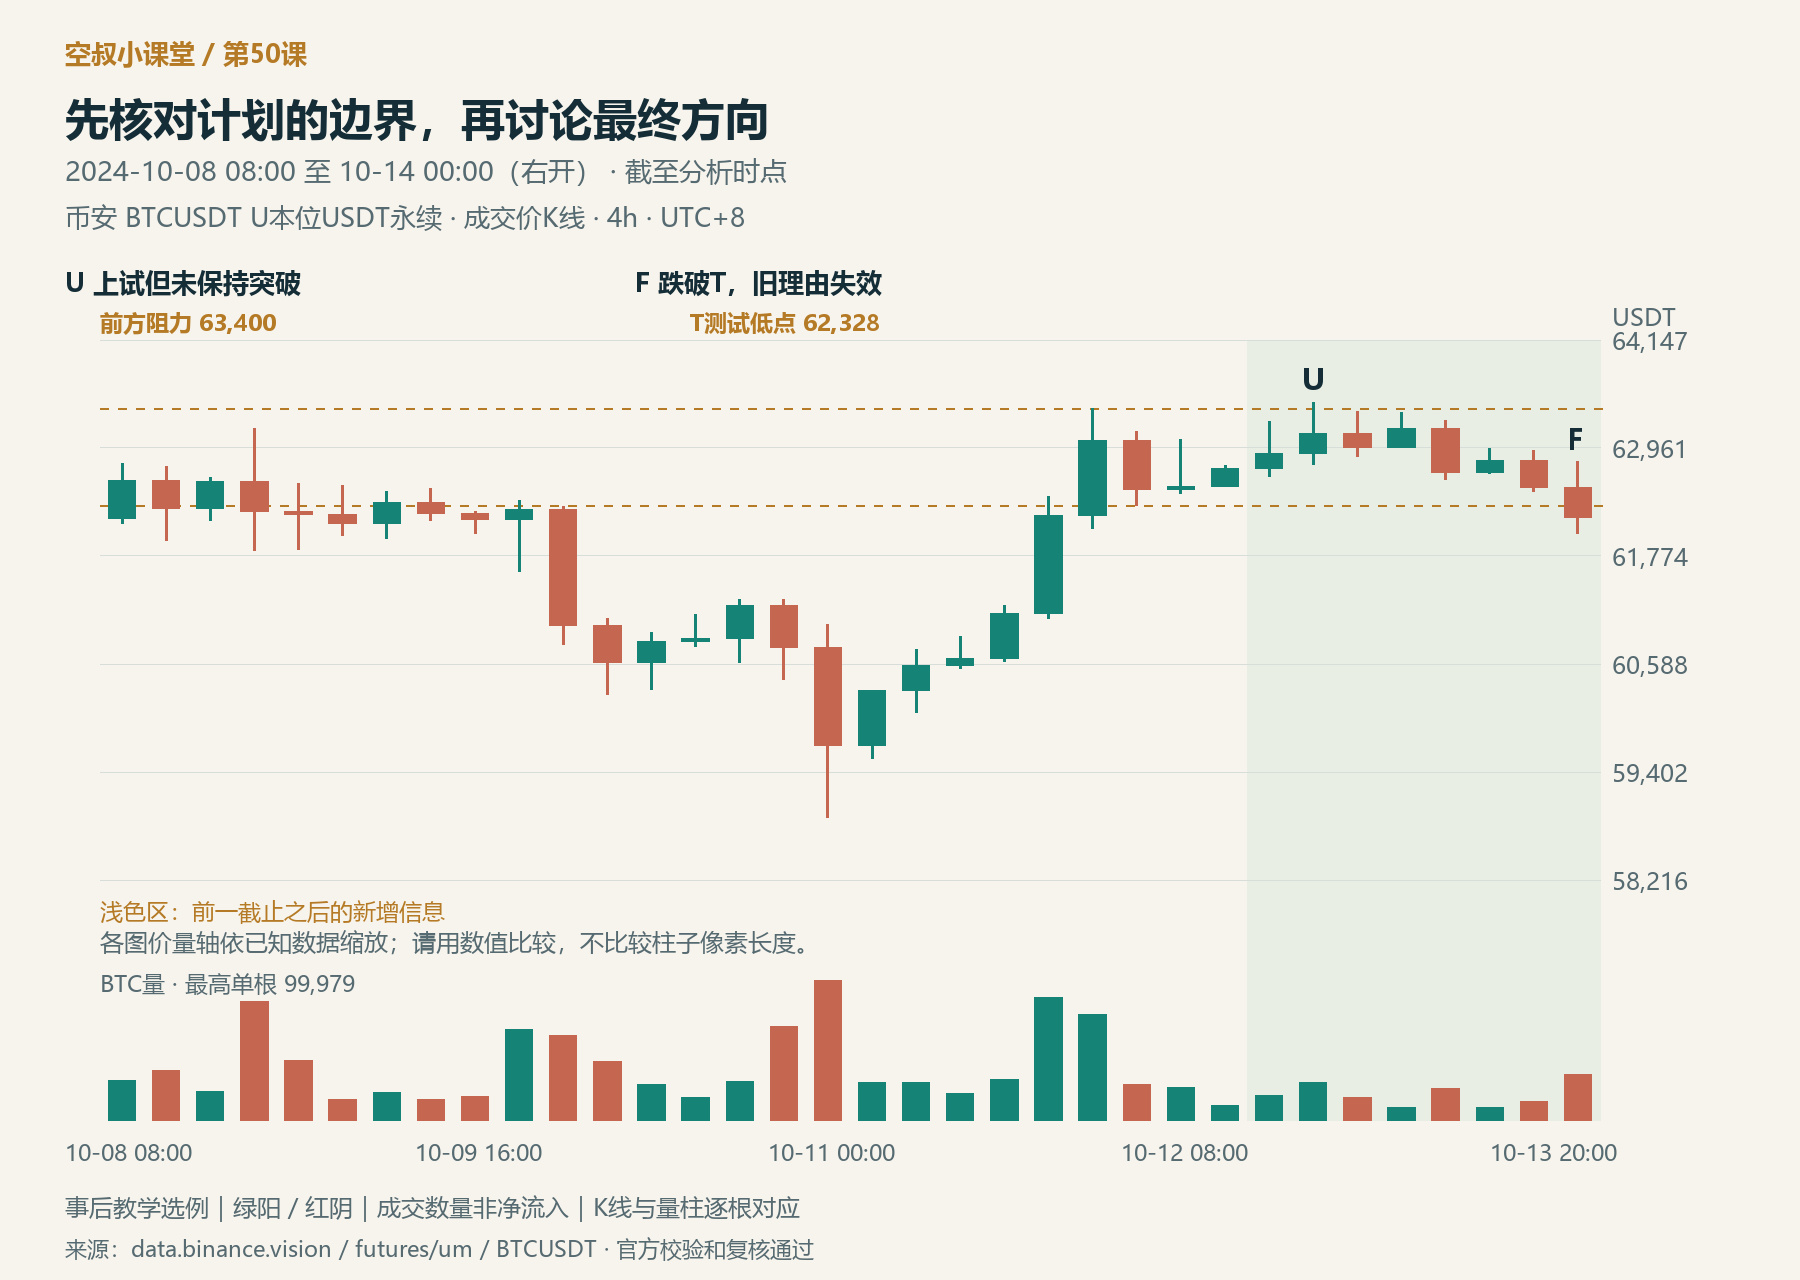
Figure 3 | The local rationale fails: U briefly moved above 63,400 but did not hold there; F then fell below T at 62,328. The lighter area on the right shows price action added after Figure 2’s cutoff.
Price did continue to test higher levels. The candle at 20:00 on the 12th reached a high of 63,462.6, briefly moving above 63,400, but closed at 63,124.8. This shows that the market attempted a breakout; it does not yet prove that price had established itself above resistance. Touching a higher price does not, by itself, mean demand has won.
The decline then deepened. The candle at 20:00 on the 13th reached a low of 62,020 and closed at 62,195.3, below T at 62,328. Its volume was about 32,600 BTC, higher than the volume around the previous two pullback candles. The decisive fact, however, is that price had lost the level the plan required it to hold.
The conclusion should now be clear: this local bullish rationale, which depended on T holding, has failed. Anyone who had not entered should cancel the plan; anyone who entered on that basis should act according to the price boundary set beforehand, not wait for this closing-price chart to remind them to exit. The 4-hour historical chart can confirm that the boundary was crossed; it cannot tell us the exact fill price of any particular order.
The scope of the failure also needs to be stated precisely. Losing 62,328 invalidates the local rationale that “this shallow pullback has held, so price can continue pushing higher from here.” Price is still above 58,900, so this does not mean the entire rally has failed, much less that a full distribution phase can be declared.
Distribution refers to supply gradually gaining the upper hand and to what happens afterward. Stronger structural evidence would require significant downward pressure, insufficient demand on the rebound, and further breaks of key support. You do not need to wait for a complete case for distribution before exiting a bullish plan; exiting also does not automatically mean you should reverse into a short.
This is a useful boundary to keep in mind when bringing together the ideas from all six chapters: structural labels can remain unsettled, but the specific rationale for entering must have clear conditions for when it applies and when it fails.
It went up later. Can I change my exit to “just hold on”?
Finally, extend the chart to 08:00 on October 15.
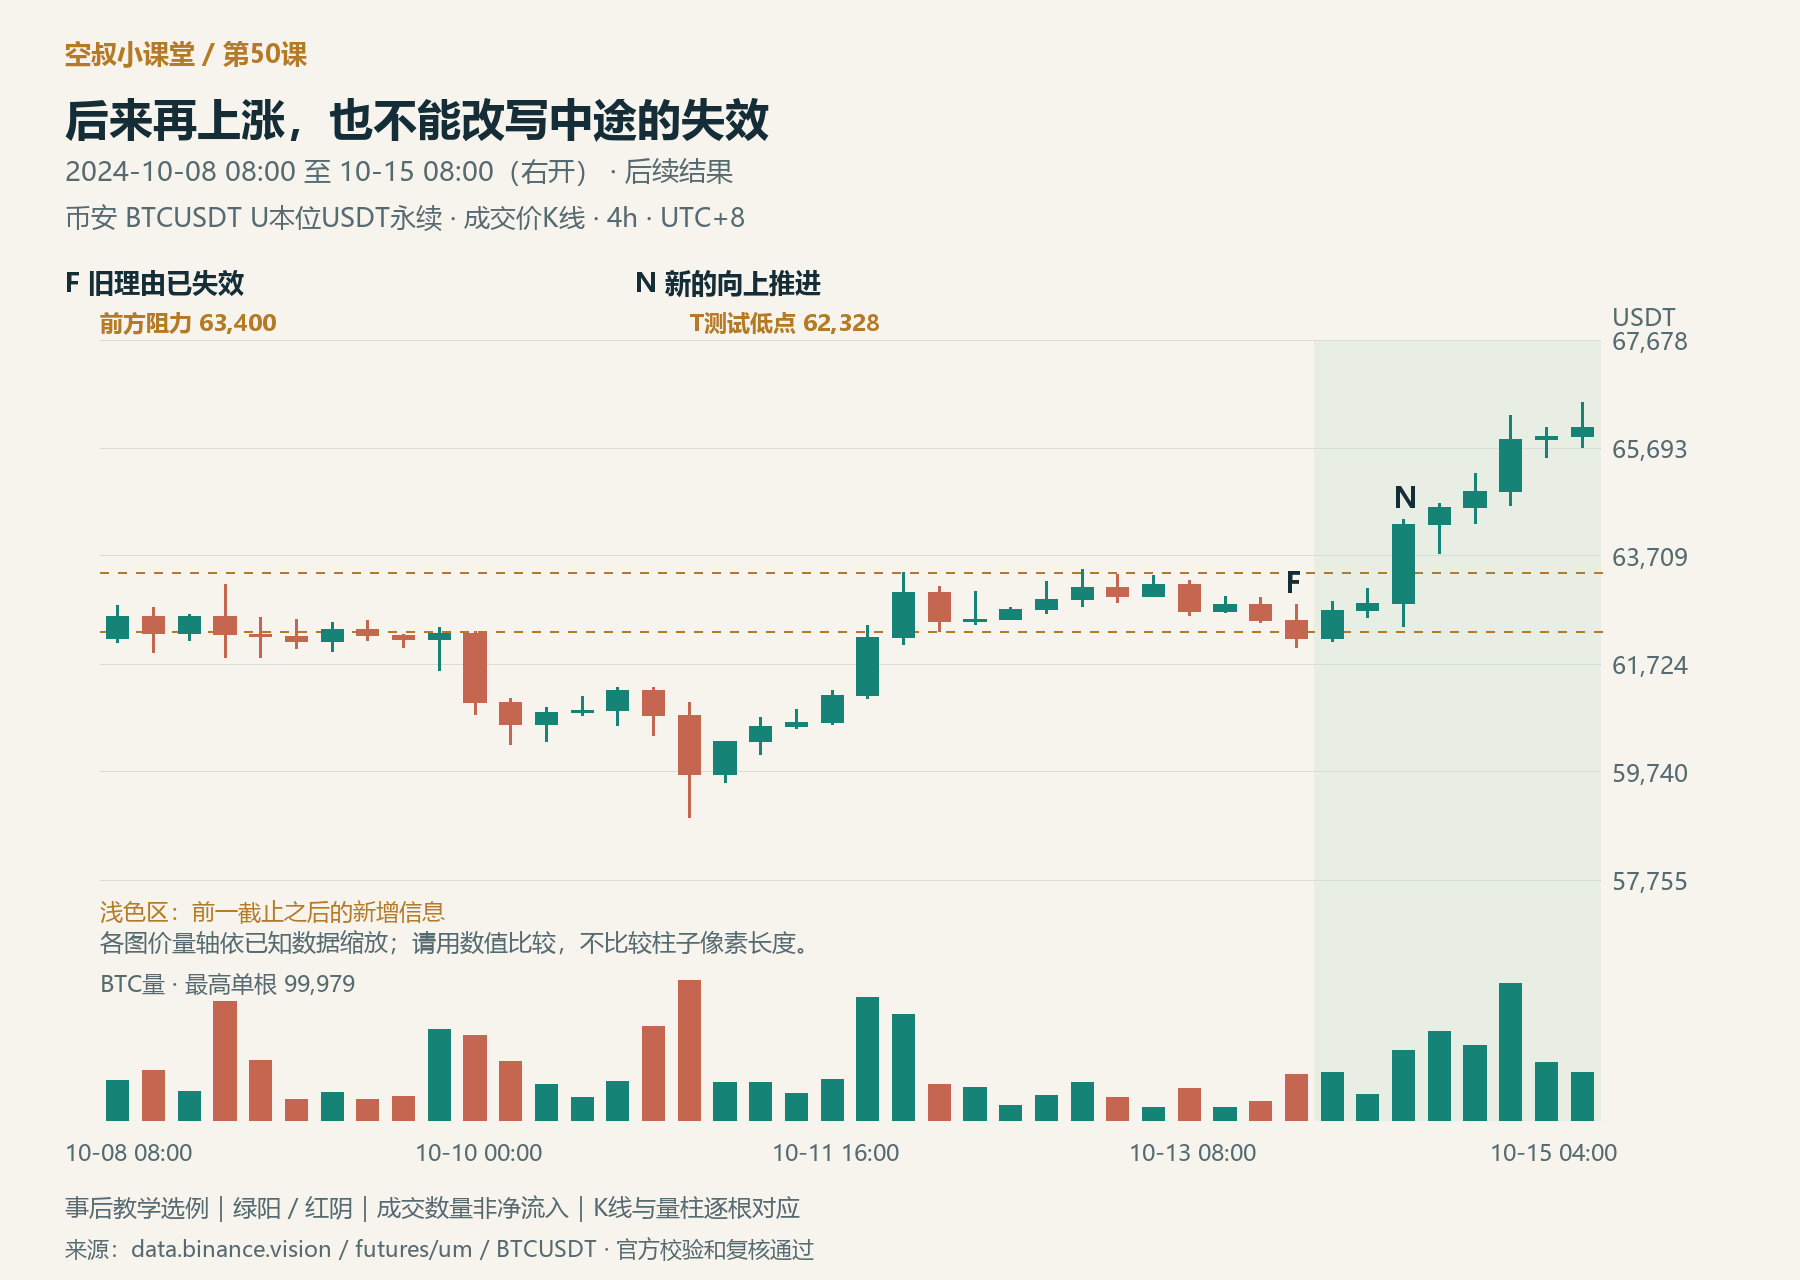
Figure 4 | The later outcome: N breaks upward again, with a subsequent high of 66,533. The lighter area begins after Figure 3’s cutoff. The earlier invalidation of the plan at F still stands.
The candle at 08:00 on the 14th reached a high of 64,377.6 and closed at 64,281.6, moving back above the earlier 63,400 area. Price continued higher afterward, reaching a high of 66,533 by the end of the formal case study.
Two things need to be checked here: Figure 2 required T to hold, but price broke below it at F, so the old plan should have ended; Figure 4 then shows a fresh upward push, meaning demand made further progress later on. Both are true. The later rise cannot erase the intervening failure, and the failure of the old plan does not mean we should ignore new evidence.
To participate again, you would need a new plan based on new levels, tests, and invalidation conditions. This example does not document any actual orders, so we cannot rewrite the later rise as profit earned by holding from before.
The textbook’s results are checked against the original expectations in the same way: there was first a basis for participating on a smaller time frame, and only later did demand follow through on a larger time frame; as the rise continued, we still assessed whether the pullback had damaged the advantage. The purpose of the results page is to check the conditions one by one, not just to show where the rise ended.
The textbook often uses CM to explain the behavior of large professional operators; this is the author’s way of describing supply and demand. The BTC volume-and-price evidence in this lesson can support inferences about changing forces, but it cannot confirm any institution’s intentions, positions, or net capital inflows.

Figure 5 | Chart-reading notes and review card: first record the scope, evidence, action, and invalidation; then reveal what followed and check each item. For teaching purposes only, not real market data; compiled for this series.
Learning recap
This brings the 50-lesson “Uncle Kong’s Trading Class” series to a close. The tools in Chapter 1 help us organize evidence; accumulation, distribution, and Spring help us examine context and the conditions that would validate a pattern; integrated analysis and results connect judgment, action, and verification.
In this complete exercise, Figure 1 called for continued patience, Figure 2 advanced the analysis to a point where participation was justified, Figure 3 required us to stop relying on the old rationale, and Figure 4 required us to acknowledge fresh demand. Learning to read charts also means limiting each judgment to what the available evidence actually supports.
When you face a new chart, try writing down your own four sentences first, then check them against what followed. The clearer the rationale and conditions in your notes, the easier it is to identify what really needs improvement in your review. Case studies in this series are learning materials, not proof of a particular win rate, profitability, or achievable returns.
Quick exercise
First, cover Figures 3 and 4. Using only the information available up to Figure 2’s cutoff, write a conditional plan of no more than 150 characters. Include the scope of your judgment, two key pieces of evidence, your current action, and how you would handle invalidation. Then reveal Figure 3 and check in one sentence: which condition of the original plan was no longer met?
Feel free to share your reasoning in the comments; don’t just answer “up” or “down.” A sample explanation will be added to the comments on this post later.