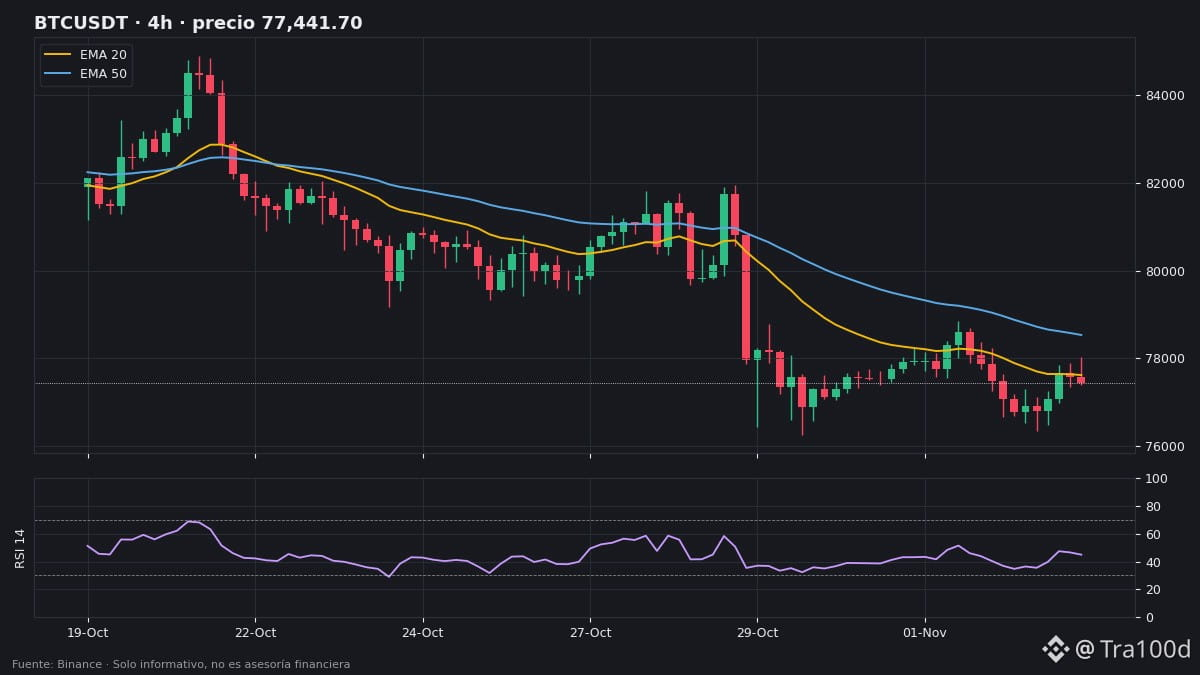
📉 $BTC is battling for $77,000 on the 4-hour chart. Where are the key levels?
🔎 Context: fear at 26/100, open interest flat (−0.4%) and funding at 0.01% (neutral).
📊 Levels (4h):
• Price: $77,020
• Below EMA 20 ($77,623), EMA 50 ($78,535) and EMA 200 ($81,054) → strong downtrend.
• RSI: 45 (recovering, neutral zone)
• Support: 20-candle low at $76,352 (on the daily chart, $76,270)
• Resistance: 20-candle high at $78,854
• ATR: $739 (~1% per candle)
🟢 Bullish scenario: reclaim the EMA 20 ($77,600), then challenge $78,500–$78,850.
🔴 Bearish scenario: losing $76,270 opens the door to the daily EMA 200 ($74,475), the major long-term benchmark.
👀 What to watch: open interest. If it starts rising again while price falls, a sharp move could trigger cascading liquidations.
Where do you see BTC tomorrow: above $78,000 or below $76,000? 👇
#BTC #Bitcoin #AnalisisTecnico #Cripto #Tra100d
⚠️ For informational and educational purposes only; this is not financial advice. Cryptocurrencies are volatile: do your own research and trade with caution.
🔎 Context: fear at 26/100, open interest flat (−0.4%) and funding at 0.01% (neutral).
📊 Levels (4h):
• Price: $77,020
• Below EMA 20 ($77,623), EMA 50 ($78,535) and EMA 200 ($81,054) → strong downtrend.
• RSI: 45 (recovering, neutral zone)
• Support: 20-candle low at $76,352 (on the daily chart, $76,270)
• Resistance: 20-candle high at $78,854
• ATR: $739 (~1% per candle)
🟢 Bullish scenario: reclaim the EMA 20 ($77,600), then challenge $78,500–$78,850.
🔴 Bearish scenario: losing $76,270 opens the door to the daily EMA 200 ($74,475), the major long-term benchmark.
👀 What to watch: open interest. If it starts rising again while price falls, a sharp move could trigger cascading liquidations.
Where do you see BTC tomorrow: above $78,000 or below $76,000? 👇
#BTC #Bitcoin #AnalisisTecnico #Cripto #Tra100d
⚠️ For informational and educational purposes only; this is not financial advice. Cryptocurrencies are volatile: do your own research and trade with caution.