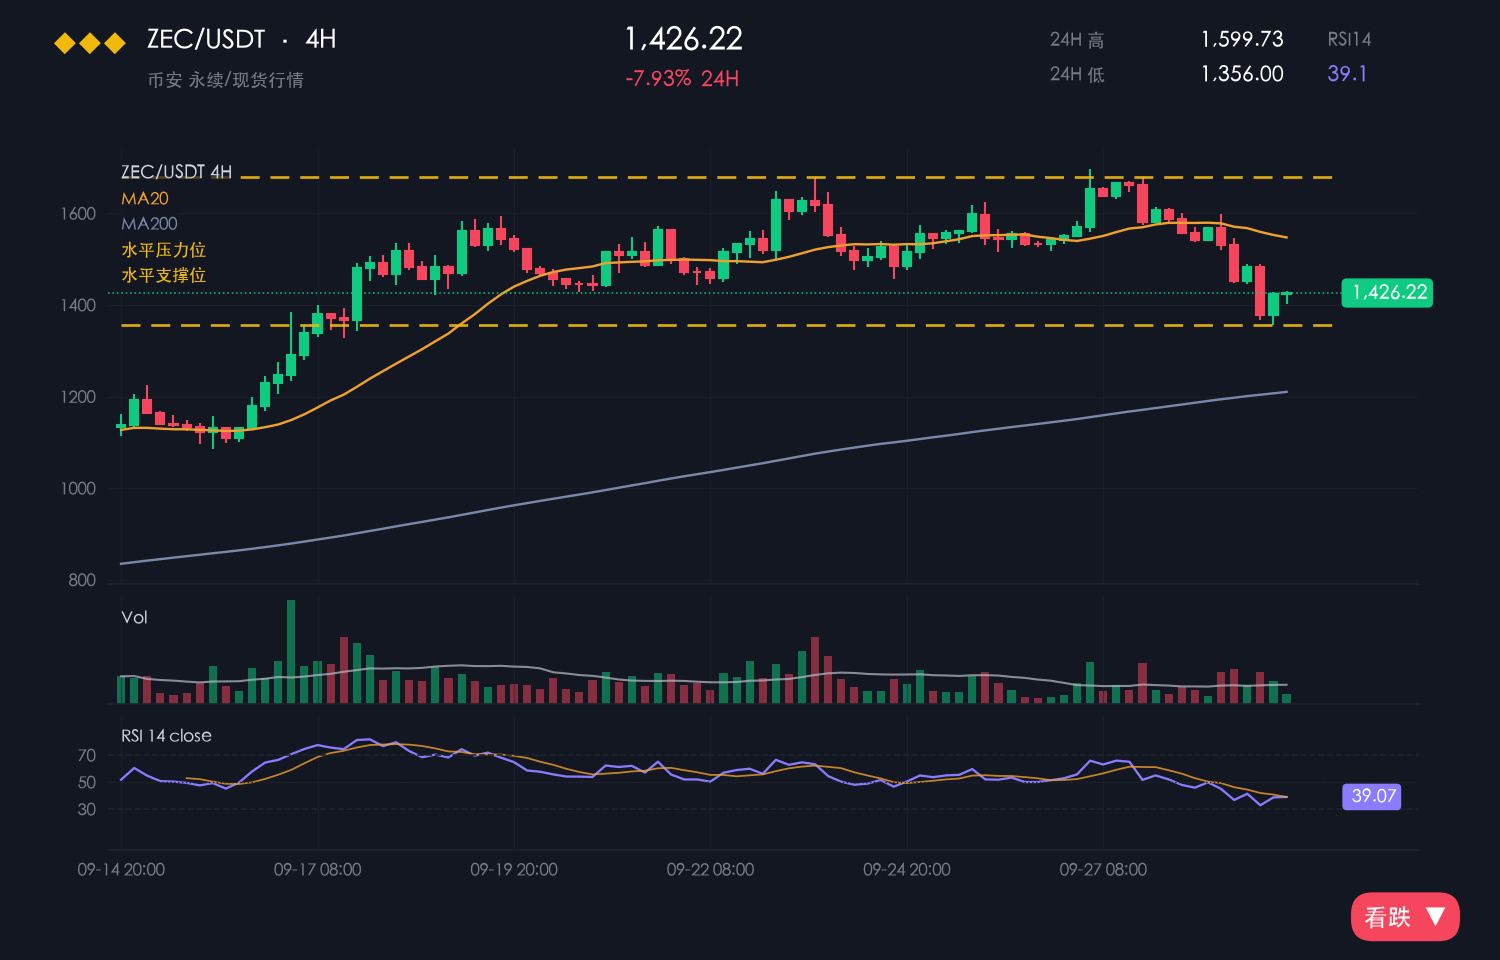
ZEC is currently at 1,259.1, down 3.50% over 24 hours but still up 3.28% over 7 days. Today's range is 1,207.0–1,398.1, with a 15.8% amplitude.
【Market action】
Well, I just opened it and saw ZEC making a very strange drop.
It didn't take long to hit 1,207.0, with the amplitude widening to 15.8%.
ZEC is down 3.50% over 24 hours. It rebounded to around 1,398.1 before being pushed back down, with heavy overhead supply from holders stuck at higher prices.
Rebounds are on declining volume while drops are on rising volume—a bearish price-volume pattern.
Compared with BTC's -2.62%, ZEC has the weakest relative strength, putting it among the assets the market has given up on.
【Macro】 U.S. stocks rose overnight, with the Nasdaq up 0.82% and the S&P 500 up 0.70% (close on 2026-10-27). Spot BTC ETFs have seen net outflows of about $45.2 billion this month, and U.S. CPI came in above expectations at 3.7% year over year. The probability of a rate hike at the 2026-10-27/28 policy meeting is about 47%. Spot BTC ETFs have seen net outflows of about $45.2 billion this month, as institutional buying wanes.
The short-term bias is bearish.
【Bearish reasons】
As for how it fell, the chart just shows that 3.50% figure—I haven't looked closely.
The 3.50% drop over 24 hours is right there; sellers have the upper hand in the short term.
With rebounds on declining volume and drops on rising volume, every bounce gets pushed back down in this kind of setup.
Anyone who knows more, care to weigh in?
A 3.50% drop doesn't mean it's bottomed. Check the volume before looking for support.
$ZEC #ZEC
【Market action】
Well, I just opened it and saw ZEC making a very strange drop.
It didn't take long to hit 1,207.0, with the amplitude widening to 15.8%.
ZEC is down 3.50% over 24 hours. It rebounded to around 1,398.1 before being pushed back down, with heavy overhead supply from holders stuck at higher prices.
Rebounds are on declining volume while drops are on rising volume—a bearish price-volume pattern.
Compared with BTC's -2.62%, ZEC has the weakest relative strength, putting it among the assets the market has given up on.
【Macro】 U.S. stocks rose overnight, with the Nasdaq up 0.82% and the S&P 500 up 0.70% (close on 2026-10-27). Spot BTC ETFs have seen net outflows of about $45.2 billion this month, and U.S. CPI came in above expectations at 3.7% year over year. The probability of a rate hike at the 2026-10-27/28 policy meeting is about 47%. Spot BTC ETFs have seen net outflows of about $45.2 billion this month, as institutional buying wanes.
The short-term bias is bearish.
【Bearish reasons】
As for how it fell, the chart just shows that 3.50% figure—I haven't looked closely.
The 3.50% drop over 24 hours is right there; sellers have the upper hand in the short term.
With rebounds on declining volume and drops on rising volume, every bounce gets pushed back down in this kind of setup.
Anyone who knows more, care to weigh in?
A 3.50% drop doesn't mean it's bottomed. Check the volume before looking for support.
$ZEC #ZEC