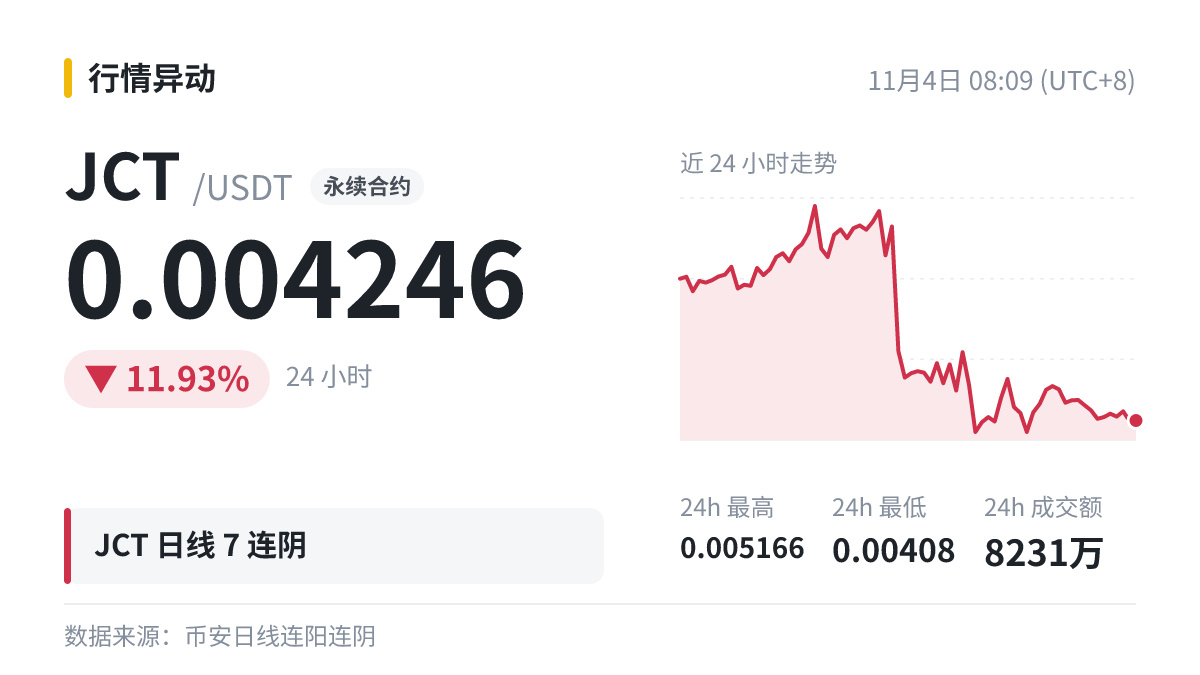
🐋 $JCT daily chart: 7 consecutive bearish candles, down a cumulative 46.22% over that period, and up 0.21% so far today.
Several consecutive days moving in the same direction means one side has consistently had the upper hand, but the longer the streak, the more important it is to watch for follow-through.
The number of consecutive down days alone isn’t a reason to trade. Many people pay closer attention to whether trading volume is increasing or decreasing across this run of candlesticks.
Working out your position size based on where you place your stop-loss is much more reliable than going by feel.
Several consecutive days moving in the same direction means one side has consistently had the upper hand, but the longer the streak, the more important it is to watch for follow-through.
The number of consecutive down days alone isn’t a reason to trade. Many people pay closer attention to whether trading volume is increasing or decreasing across this run of candlesticks.
Working out your position size based on where you place your stop-loss is much more reliable than going by feel.