Analyzing Ethereum’s On-Chain Dynamics: An In-Depth Look at Supply and Liquidity Data
The chart from Santiment shows an important intersection between the price movement of $ETH and indicators of supply available on exchanges, allowing for a more precise analysis of liquidity trends and investor behavior over the period from June to November.
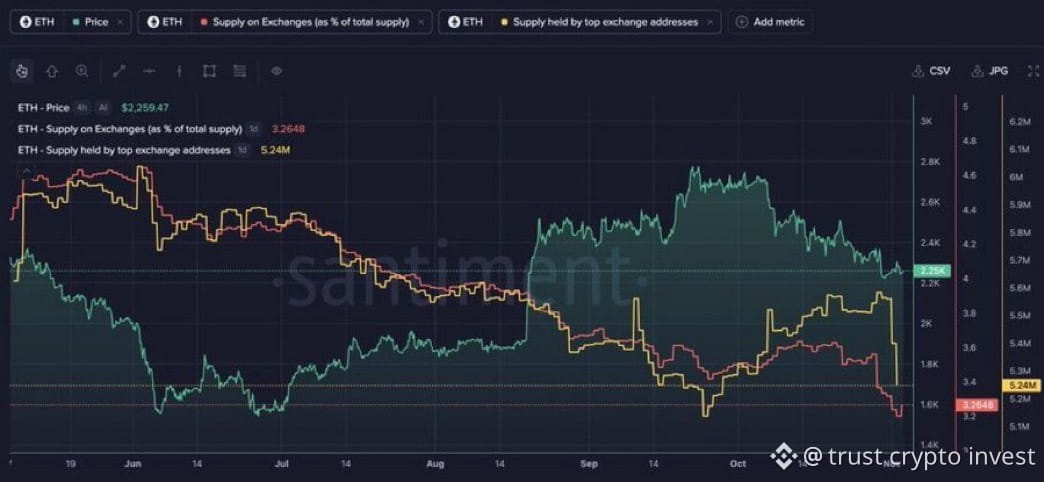
• The green line shows Ethereum’s price, currently hovering around $2,259, after wide fluctuations that included a sharp decline followed by a recovery and subsequent correction. Meanwhile, the percentage of supply on exchanges, shown in red, and the supply held at top exchange addresses, shown in yellow, follow a similar trajectory, indicating a gradual decline in the amount of coins held on exchanges.
This notable decline in exchange supply suggests that investors are inclined to withdraw their assets and store them for the long term in cold or private wallets. This often reduces direct selling pressure in the spot market. The interplay between declining liquidity available on exchanges and price movements is a key indicator for analysts tracking buying and selling pressure and gauging market sentiment independently of short-term price fluctuations.
The chart from Santiment shows an important intersection between the price movement of $ETH and indicators of supply available on exchanges, allowing for a more precise analysis of liquidity trends and investor behavior over the period from June to November.
• The green line shows Ethereum’s price, currently hovering around $2,259, after wide fluctuations that included a sharp decline followed by a recovery and subsequent correction. Meanwhile, the percentage of supply on exchanges, shown in red, and the supply held at top exchange addresses, shown in yellow, follow a similar trajectory, indicating a gradual decline in the amount of coins held on exchanges.
This notable decline in exchange supply suggests that investors are inclined to withdraw their assets and store them for the long term in cold or private wallets. This often reduces direct selling pressure in the spot market. The interplay between declining liquidity available on exchanges and price movements is a key indicator for analysts tracking buying and selling pressure and gauging market sentiment independently of short-term price fluctuations.