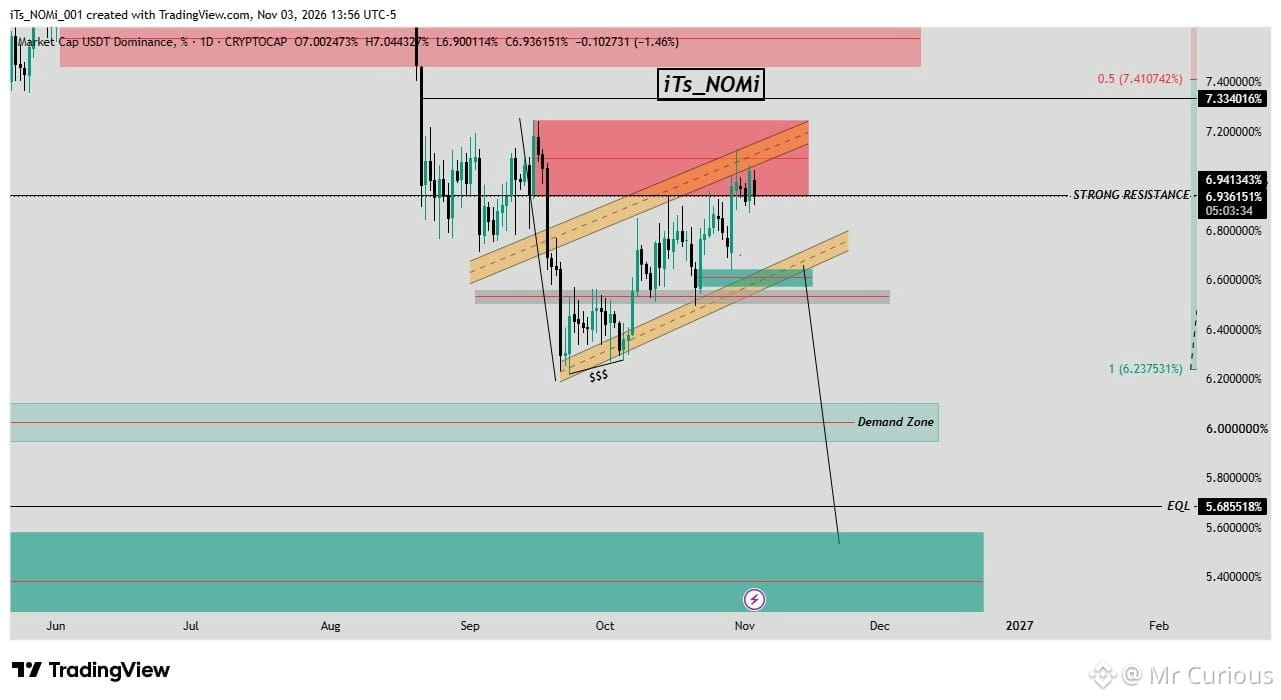
#USDT.D – Daily Timeframe
USDT.D is currently trading inside a bearish flag pattern and is also positioned within a strong supply zone.
If USDT.D follows this pattern and breaks down as expected, it could create significant bullish momentum for Bitcoin, potentially pushing BTC towards $98K.
However, this is a swing-timeframe analysis, so it will take time to play out. Patience is required.
My Trading Plan:
I will look for swing trade opportunities once the market reaches our $74K–$72K BTC buying zone.
No need to rush. We will wait for proper confirmation before entering any swing positions. ❤️
$BTC
$ETH
$XAU
USDT.D is currently trading inside a bearish flag pattern and is also positioned within a strong supply zone.
If USDT.D follows this pattern and breaks down as expected, it could create significant bullish momentum for Bitcoin, potentially pushing BTC towards $98K.
However, this is a swing-timeframe analysis, so it will take time to play out. Patience is required.
My Trading Plan:
I will look for swing trade opportunities once the market reaches our $74K–$72K BTC buying zone.
No need to rush. We will wait for proper confirmation before entering any swing positions. ❤️
$BTC
$ETH
$XAU