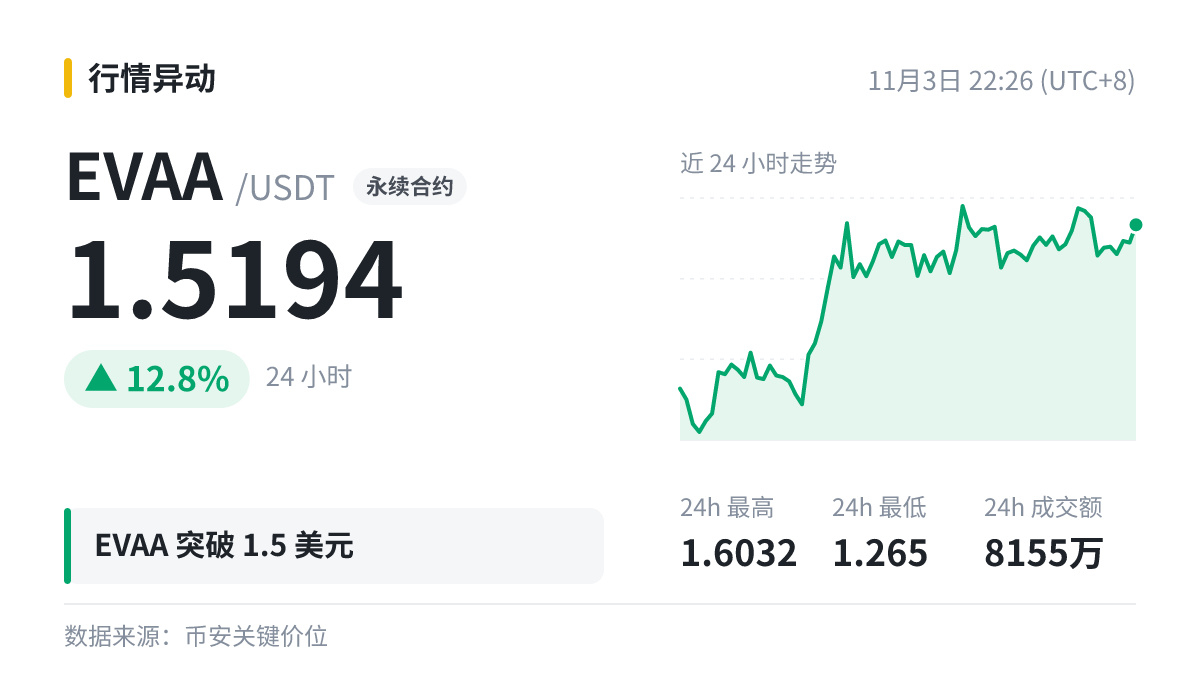
$EVAA breaks through the 1.5 level.
Let’s use this figure to break down key price levels.
Previous highs and lows are the most common key price levels: the memory of prices failing to rise or being supported at these levels last time often influences decisions when they return to the same levels.
When prices repeatedly cross above and below a key level, both bulls and bears can easily get stopped out. Keeping positions small is often the safer approach until the direction becomes clear.
It’s safer to look for confirmation from multiple data points than to rely on just one, but even a large number of indicators can’t provide a definitive conclusion.
Let’s use this figure to break down key price levels.
Previous highs and lows are the most common key price levels: the memory of prices failing to rise or being supported at these levels last time often influences decisions when they return to the same levels.
When prices repeatedly cross above and below a key level, both bulls and bears can easily get stopped out. Keeping positions small is often the safer approach until the direction becomes clear.
It’s safer to look for confirmation from multiple data points than to rely on just one, but even a large number of indicators can’t provide a definitive conclusion.