$BMT
🔥 $BMT / USDT Technical Breakdown & Trade Setup!
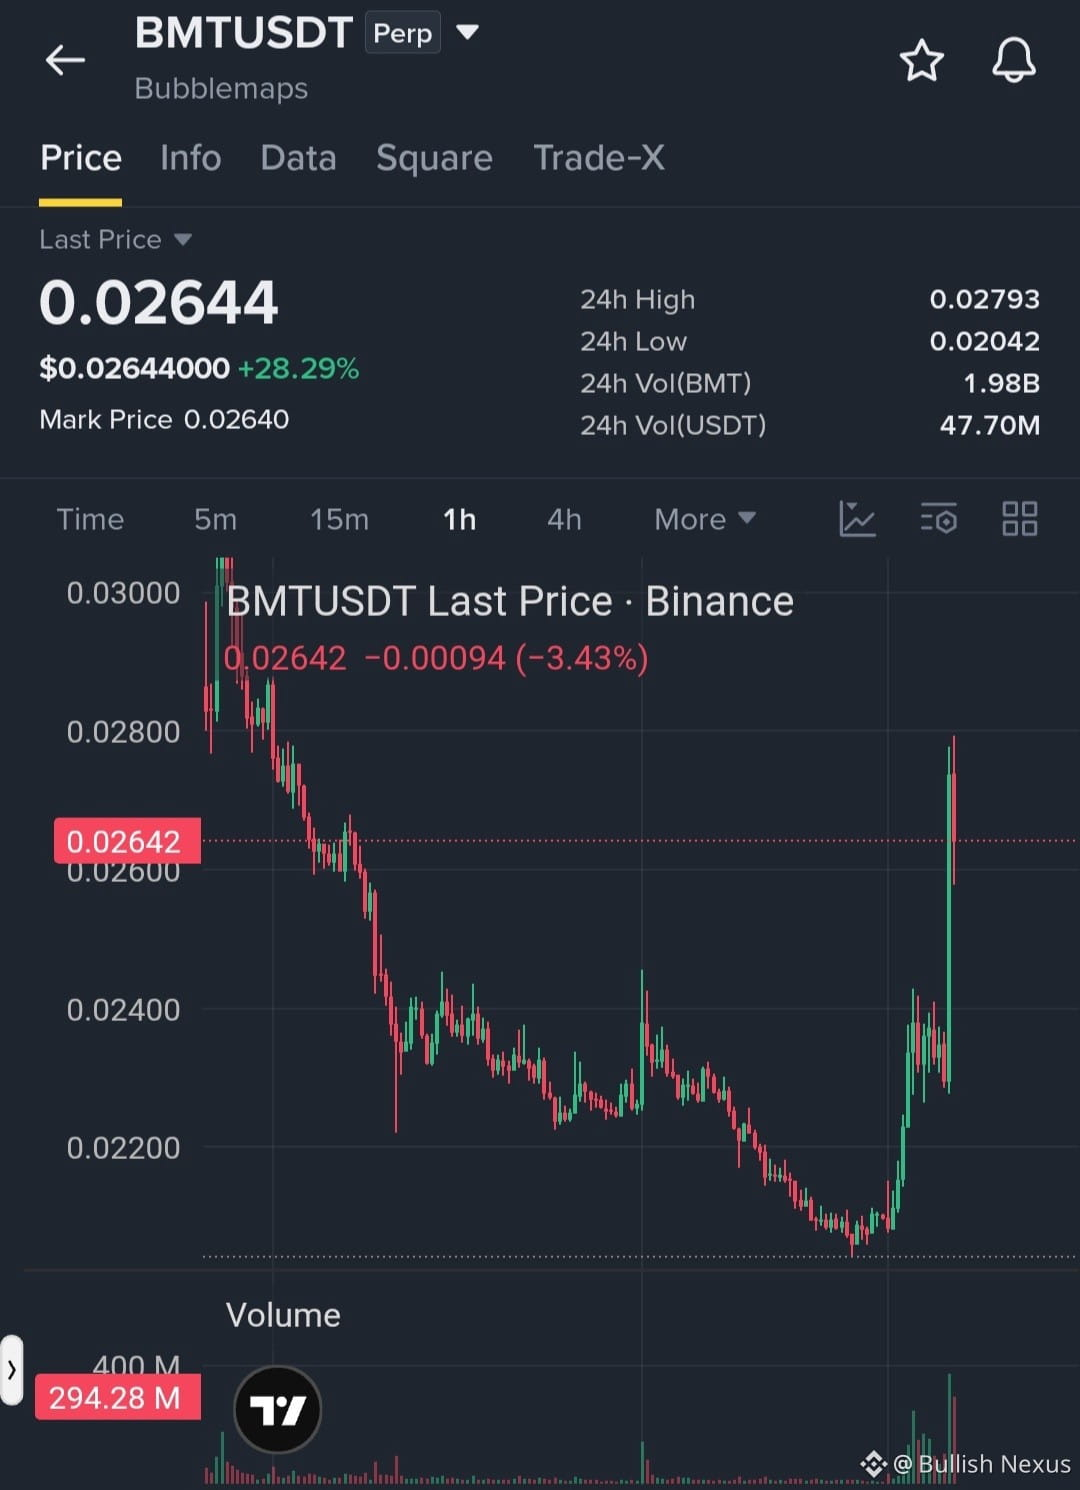
$BMT is showing massive bullish momentum on the lower timeframes, printing a strong impulsive breakout with heavy volume! Let's break down the 1H-4H charts and plan our next move carefully. 🚀
📊 Market Structure Analysis:
1H Chart: Sharp vertical impulse reaching a 24h high of 0.02793, currently cooling down slightly around 0.02657. Moving averages (MA7, MA25, MA99) are in a strong bullish alignment. RSI(6) is at 74.18, showing strong near-term momentum.
4H Chart: Macro breakout confirmed above key moving averages after a prolonged downtrend. RSI(6) at 83.60 indicates high impulsive volume, so chasing green candles right now carries short-term retracement risk.
🎯 Trade Setup & Plan (Long Strategy):
Entry Zone (Dips): Look for healthy pullbacks to the 0.02380 – 0.02460 support cluster (near rising MA supports) rather than entering at market price.
Stop-Loss (SL): Strict stop-loss below structural invalidation at 0.02200 to manage risk properly.
🎯 Take-Profit Targets:
TP1: 0.02950 (Immediate local resistance)
TP2: 0.03300 (Mid-range liquidity pocket)
TP3: 0.03850 – 0.04100 (Higher timeframe swing target)
Manage your risk tightly and wait for the right re-test entry! Drop your thoughts below. 👇
#BMTUSDT
🔥 $BMT / USDT Technical Breakdown & Trade Setup!
$BMT is showing massive bullish momentum on the lower timeframes, printing a strong impulsive breakout with heavy volume! Let's break down the 1H-4H charts and plan our next move carefully. 🚀
📊 Market Structure Analysis:
1H Chart: Sharp vertical impulse reaching a 24h high of 0.02793, currently cooling down slightly around 0.02657. Moving averages (MA7, MA25, MA99) are in a strong bullish alignment. RSI(6) is at 74.18, showing strong near-term momentum.
4H Chart: Macro breakout confirmed above key moving averages after a prolonged downtrend. RSI(6) at 83.60 indicates high impulsive volume, so chasing green candles right now carries short-term retracement risk.
🎯 Trade Setup & Plan (Long Strategy):
Entry Zone (Dips): Look for healthy pullbacks to the 0.02380 – 0.02460 support cluster (near rising MA supports) rather than entering at market price.
Stop-Loss (SL): Strict stop-loss below structural invalidation at 0.02200 to manage risk properly.
🎯 Take-Profit Targets:
TP1: 0.02950 (Immediate local resistance)
TP2: 0.03300 (Mid-range liquidity pocket)
TP3: 0.03850 – 0.04100 (Higher timeframe swing target)
Manage your risk tightly and wait for the right re-test entry! Drop your thoughts below. 👇
#BMTUSDT