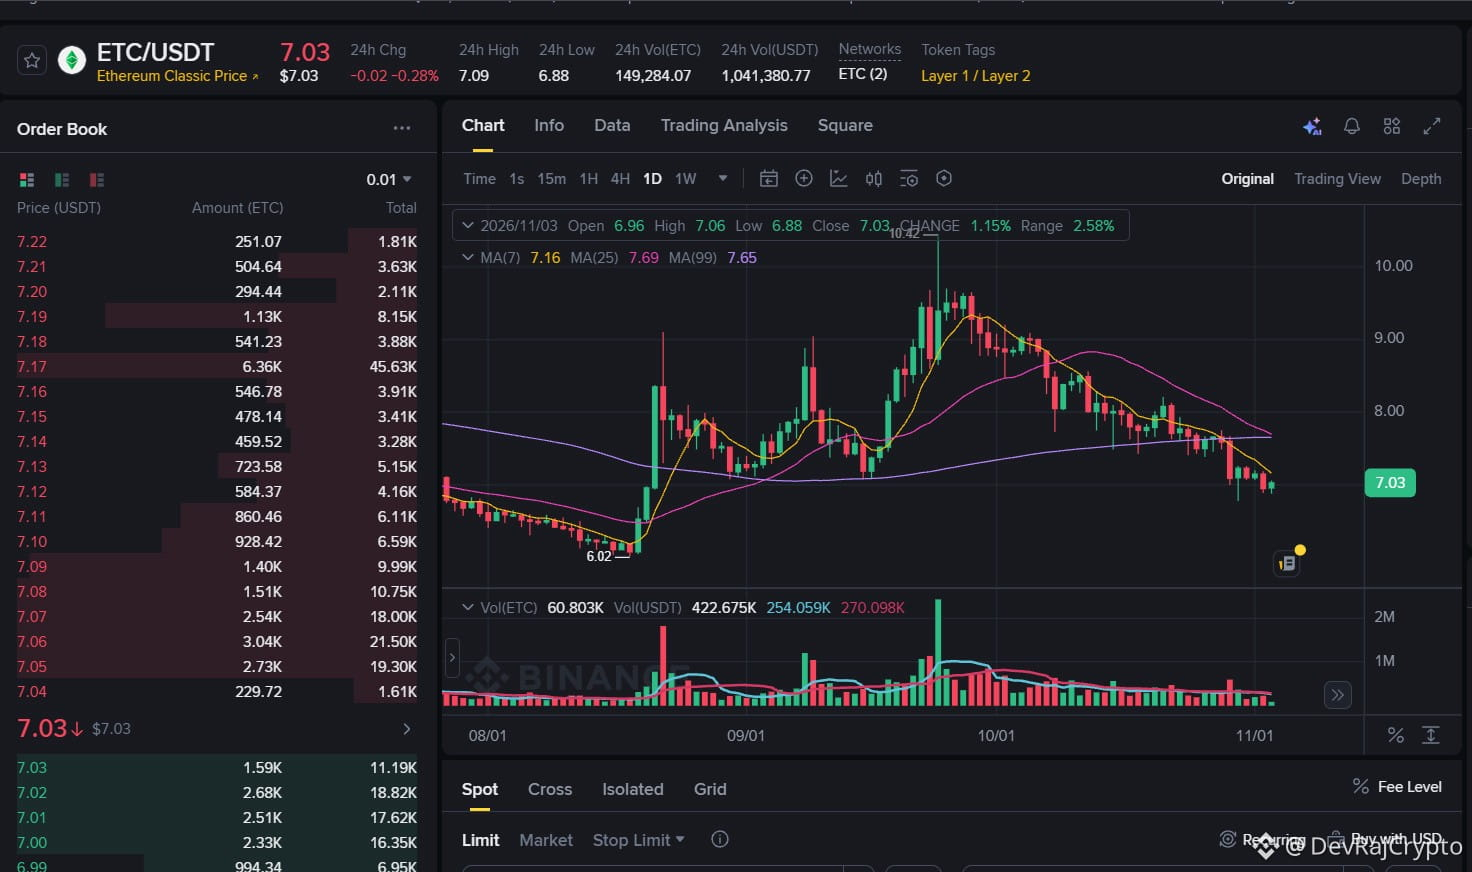
Ethereum Classic is trading near $7.03, and I believe the $7.65-$7.70 region is more important than the next short-term bounce.
ETC has declined considerably from its September high near $10.42. The daily chart suggests sellers still have control, and buyers haven't demonstrated a convincing trend reversal.
Three indicators explain why I'm cautious:
• Current price: $7.03
• 7-day moving average: $7.16
• 25-day moving average: $7.69
• 99-day moving average: $7.65
• Recent daily low: $6.88
Here's what catches my attention.
The 25-day and 99-day moving averages are converging around $7.65-$7.69. Both sit above the current price, creating an important resistance zone to watch.
This matters because a price recovery alone doesn't establish a trend reversal. Buyers need to reclaim these averages and demonstrate that they can hold above them.
In my approach to reading crypto charts, I pay more attention to how price behaves around key levels than to isolated green candles. A temporary bounce can attract attention, but sustained buying pressure is what changes the market structure.
For ETC, I'm watching three developments:
1. Can buyers reclaim $7.16, the 7-day average?
2. Can price eventually break and hold above $7.65-$7.70?
3. Will $6.88 hold as immediate support, or will sellers push price lower?
A sustained break below $6.88 would weaken the current setup further. Conversely, reclaiming the moving-average cluster would improve the recovery outlook.
My position is cautious: I wouldn't call this accumulation simply because ETC is trading near $7.
The market doesn't confirm a recovery because an asset looks cheaper. It confirms one when buyers demonstrate control.
What's your view on $ETC? Is this a potential base, or is another leg down still possible?
#ETC #EthereumClassic #CryptoAnalysis #BinanceSquare
Technical analysis based on the Binance ETC/USDT daily chart, November 3, 2026. Not financial advice.
ETC has declined considerably from its September high near $10.42. The daily chart suggests sellers still have control, and buyers haven't demonstrated a convincing trend reversal.
Three indicators explain why I'm cautious:
• Current price: $7.03
• 7-day moving average: $7.16
• 25-day moving average: $7.69
• 99-day moving average: $7.65
• Recent daily low: $6.88
Here's what catches my attention.
The 25-day and 99-day moving averages are converging around $7.65-$7.69. Both sit above the current price, creating an important resistance zone to watch.
This matters because a price recovery alone doesn't establish a trend reversal. Buyers need to reclaim these averages and demonstrate that they can hold above them.
In my approach to reading crypto charts, I pay more attention to how price behaves around key levels than to isolated green candles. A temporary bounce can attract attention, but sustained buying pressure is what changes the market structure.
For ETC, I'm watching three developments:
1. Can buyers reclaim $7.16, the 7-day average?
2. Can price eventually break and hold above $7.65-$7.70?
3. Will $6.88 hold as immediate support, or will sellers push price lower?
A sustained break below $6.88 would weaken the current setup further. Conversely, reclaiming the moving-average cluster would improve the recovery outlook.
My position is cautious: I wouldn't call this accumulation simply because ETC is trading near $7.
The market doesn't confirm a recovery because an asset looks cheaper. It confirms one when buyers demonstrate control.
What's your view on $ETC? Is this a potential base, or is another leg down still possible?
#ETC #EthereumClassic #CryptoAnalysis #BinanceSquare
Technical analysis based on the Binance ETC/USDT daily chart, November 3, 2026. Not financial advice.