$BTC High-leverage positions on both sides are getting increasingly crowded!
A liquidation band is lighting up near $77,500 above.
The $76,000–$76,500 area below is just as crowded!
The price is rebounding and approaching the dense zone above.
Who will crack first in this sweep!
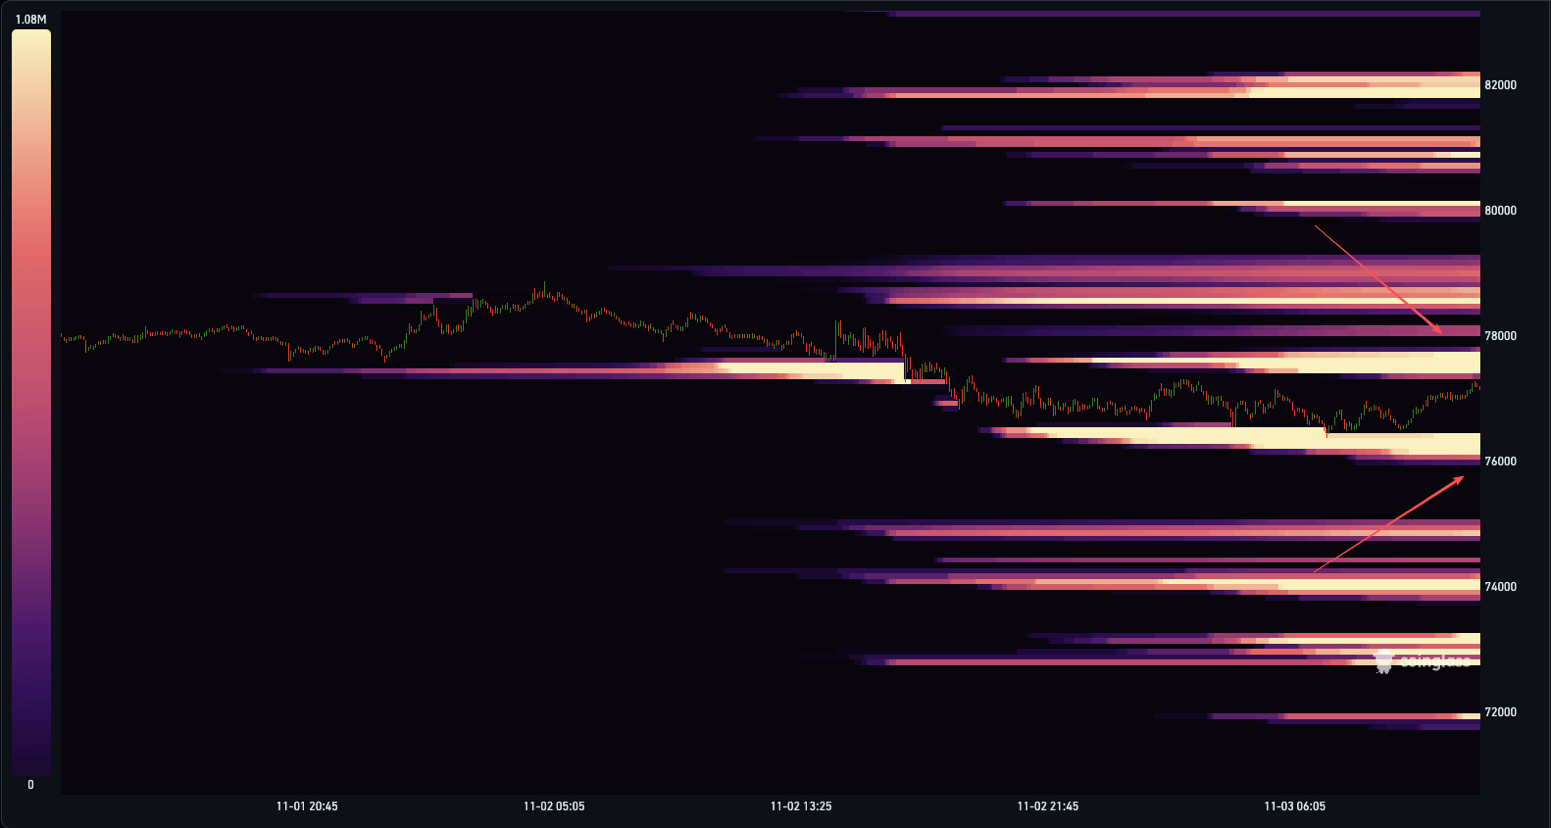
On this 48-hour liquidation heatmap, BTC previously pulled back from around $78,000, then rebounded in its latest move from around $76,500 to approximately $77,200. The nearest dense band above the price is concentrated around $77,500, with the $78,500–$79,000 area farther up. Below, there is also a notable buildup of potential long liquidations at $76,000–$76,500. Either side could amplify short-term volatility.
I’ll first be watching the battle around $77,500. If buyers break through this dense band and hold it on a retest, forced short covering could add fuel to the rebound. The next level to watch is $78,000, followed by $78,500–$79,000. If the rebound stalls and selling pressure returns, $76,000–$76,500 could easily become a liquidation target. Especially if $76,000 is decisively lost, watch for the move to extend toward $75,000 and $74,000.
If bulls take $77,500 and hold above it, shorts could be forced to cover in succession.
If the price sweeps lower first, then quickly reclaims $76,500, buyers may still have a chance to turn the tables and launch a rally!
Tap the card below to get trading! 👇
$ETH $ZEC
A liquidation band is lighting up near $77,500 above.
The $76,000–$76,500 area below is just as crowded!
The price is rebounding and approaching the dense zone above.
Who will crack first in this sweep!
On this 48-hour liquidation heatmap, BTC previously pulled back from around $78,000, then rebounded in its latest move from around $76,500 to approximately $77,200. The nearest dense band above the price is concentrated around $77,500, with the $78,500–$79,000 area farther up. Below, there is also a notable buildup of potential long liquidations at $76,000–$76,500. Either side could amplify short-term volatility.
I’ll first be watching the battle around $77,500. If buyers break through this dense band and hold it on a retest, forced short covering could add fuel to the rebound. The next level to watch is $78,000, followed by $78,500–$79,000. If the rebound stalls and selling pressure returns, $76,000–$76,500 could easily become a liquidation target. Especially if $76,000 is decisively lost, watch for the move to extend toward $75,000 and $74,000.
If bulls take $77,500 and hold above it, shorts could be forced to cover in succession.
If the price sweeps lower first, then quickly reclaims $76,500, buyers may still have a chance to turn the tables and launch a rally!
Tap the card below to get trading! 👇
$ETH $ZEC