
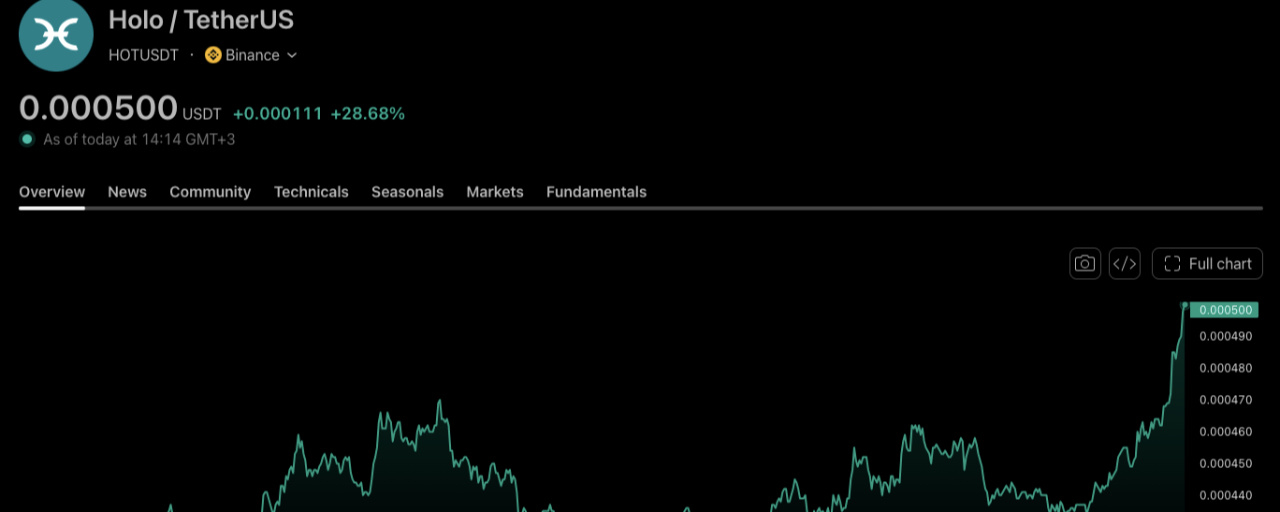

What a year of nothing looks like right before everything.
For 387 days, HOT/USDT did almost nothing. No trend, no breakout, no drama. Just a flat line that made most traders close the tab and stop checking.
Then, in about two weeks, it ran roughly 56%.
If you were watching, you probably felt two things at once: I should have seen that coming, and I never would have held through that. Both are fair. Here is what's actually going on in a move like this, and what to take from it.
The 387 days
A year-plus of sideways price action is not a pause. It is a process.
Every week the chart stays flat, three things happen. Impatient holders sell to put their money somewhere that moves. Volume shrinks and attention drifts to louder coins. And the remaining holders get either stubborn or bored, and either way they stop adding.
By the end, the people who wanted out are mostly out. The price is quiet because sellers have run low on reasons to sell. That is the setup, and it looks identical to a dead coin right up until the day it doesn't.
Why a flat chart ends in a big move
Long ranges compress price. When the chart finally leaves the range, there's little supply sitting overhead from people trapped at higher prices, so even modest buying can move it fast.
The other piece is liquidity. HOT is a small-cap token. Recent figures on trackers put its market cap in the tens of millions of dollars, and daily trading volume often runs somewhere between about $100,000 and a few hundred thousand dollars. A market that thin doesn't need a huge flow of money to move 56%. It needs a small amount of persistent buying and not many sellers willing to meet it.
That cuts both ways. Thin markets rise fast, and they can drop just as fast.
Why you can't chase this
The hardest truth about breakouts: the best entry is the one nobody wants. It's day 300 of a boring range, when buying feels pointless.
By the time the chart shows +56%, the risk-reward has flipped. You'd be buying after a big move in a thin market, with your stop either far away or too tight to survive normal pullbacks. That is how late buyers end up becoming exit liquidity for the people who were there early.
If you missed it, you did not lose anything. You just did not take a trade. The next one will look similar.
What to take from it
Sideways is information. A tight, long range means energy is building, not that nothing is happening. Put it on a watchlist and wait for the market to show its hand.
Wait for confirmation, not prediction. You don't need to catch the exact bottom. A clean break above the range on rising volume, with a defined level where you're wrong, is a trade you can size.
Size for thin markets. Low liquidity means slippage and violent reversals. Smaller positions, limit orders, and a plan for exiting before you need to.
Have an exit before you enter. After a 56% move, the question is no longer where to buy. It's where you take profits and where the trade is invalid.
Don't confuse a move with a trend. Two weeks is a burst. Whether it holds is decided by what happens on the first pullback.
For the trader reading this
If you sat in this coin for a year and watched it do nothing, you did something harder than any single trade. You held through boredom, and boredom is where most people lose their nerve.
If you missed it, don't punish yourself. Every trader has a list of moves they didn't take. The urge to jump into the next one just to make up for it is how small misses turn into real losses.
And if you're up on this one, take a breath before the next decision. Winning on a small-cap makes the next trade feel easier than it is. Write down your plan while you're calm.
And if trading has started to weigh on you more than the numbers explain, talk to someone. A friend, family, or a professional. A good trader is still a person.
Educational only, not financial advice. Check the chart and the numbers yourself before you trade anything.