Does history always repeat itself in strikingly similar ways? 🇺🇸
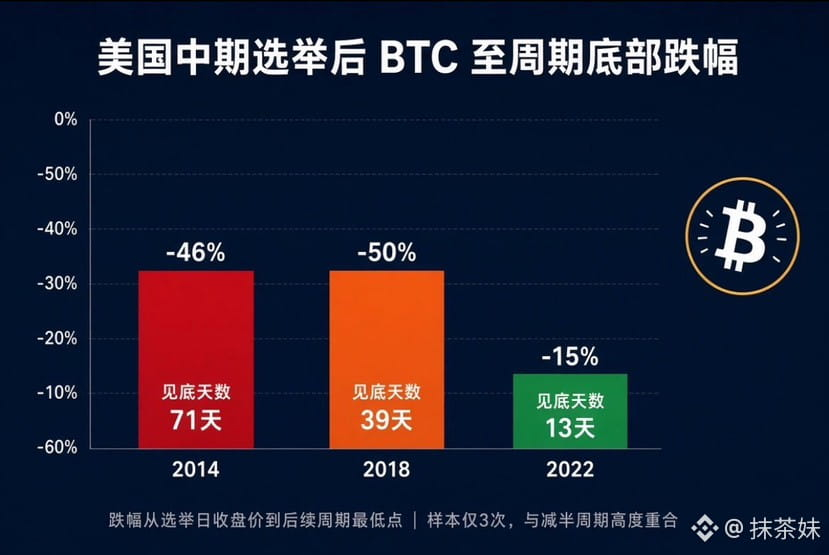
After each of the last three U.S. midterm elections, Bitcoin hit a local low within a certain period of time.
📉 2014: 71 days, down about 46%
📉 2018: 39 days, down about 50%
📉 2022: 13 days, down about 15%
71 days → 39 days → 13 days.
Looking only at these three data points, it seems that each cycle has taken less time to bottom out.
So here's the question:
Will BTC hit another low after the 2026 U.S. midterm elections?
If history repeats itself, how much further could it fall this time?
If the pattern no longer holds, could we already be at the bottom?
Of course, three historical examples aren't enough to prove that a pattern exists, and the 2022 bottom was also affected by events such as the collapse of FTX.
But what I really want to know is:
Do you think BTC will see another deep correction this time, or has it already bottomed out early?
#美国中期选举倒计时,美股博弈窗口已开启? $BTC
After each of the last three U.S. midterm elections, Bitcoin hit a local low within a certain period of time.
📉 2014: 71 days, down about 46%
📉 2018: 39 days, down about 50%
📉 2022: 13 days, down about 15%
71 days → 39 days → 13 days.
Looking only at these three data points, it seems that each cycle has taken less time to bottom out.
So here's the question:
Will BTC hit another low after the 2026 U.S. midterm elections?
If history repeats itself, how much further could it fall this time?
If the pattern no longer holds, could we already be at the bottom?
Of course, three historical examples aren't enough to prove that a pattern exists, and the 2022 bottom was also affected by events such as the collapse of FTX.
But what I really want to know is:
Do you think BTC will see another deep correction this time, or has it already bottomed out early?
#美国中期选举倒计时,美股博弈窗口已开启? $BTC