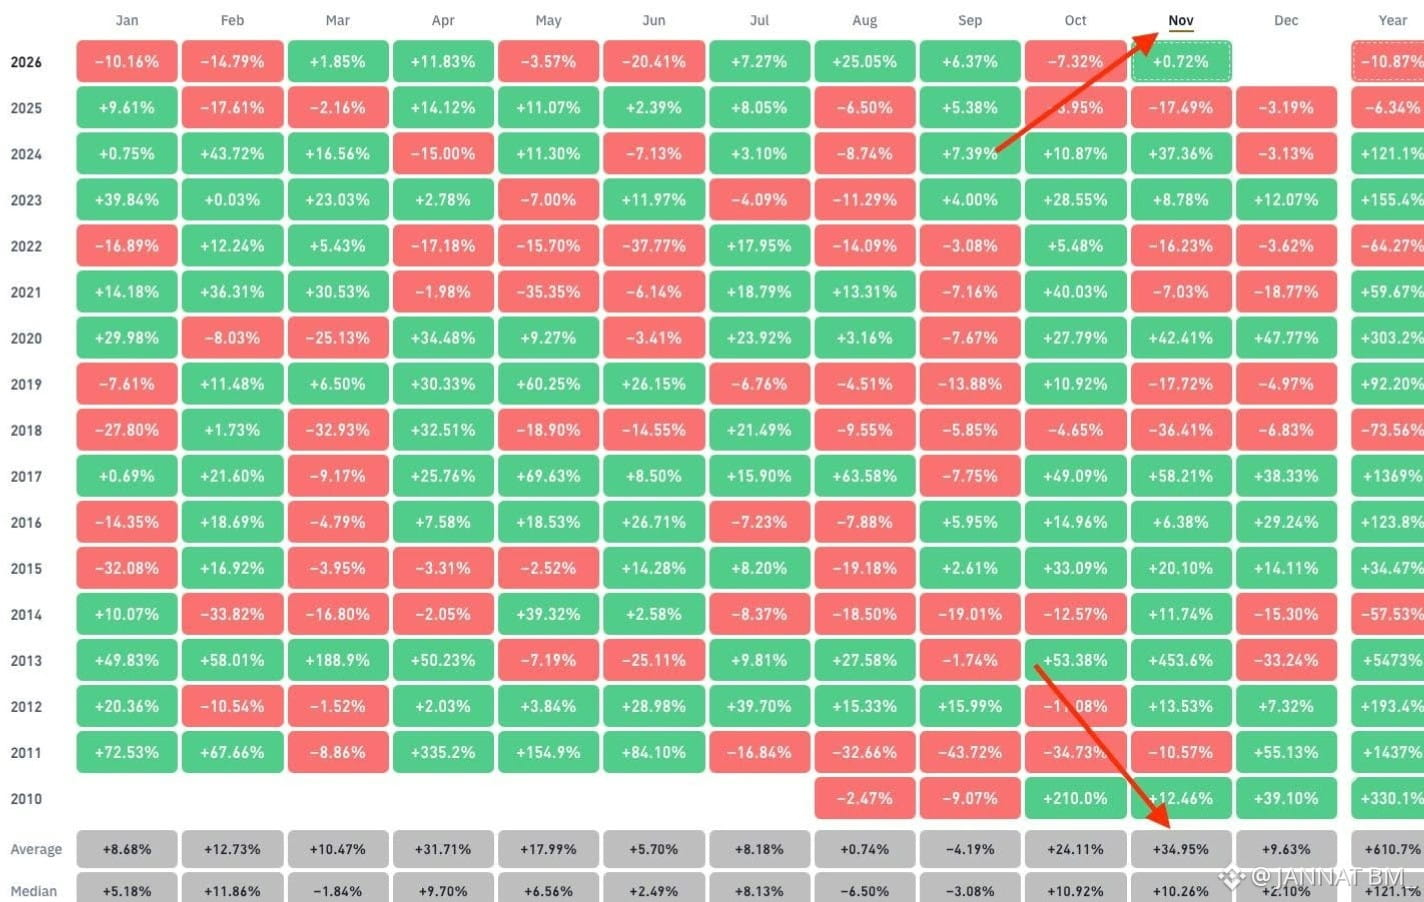
Bitcoin closed October down 7.32%. But November comes with a very different historical story.
There is something interesting about how people react to the Bitcoin market. A negative monthly close often changes the entire mood. Suddenly, traders become cautious, investors start questioning their positions, and discussions shift toward how much further the market could fall. But market history has a habit of reminding us that short-term performance and broader market behavior are not always telling the same story.
October ended with a -7.32% return for $BTC . That's not exactly the kind of monthly close bulls wanted to see. It creates uncertainty, especially for people who entered the market expecting another strong continuation.
However, November has historically carried a different reputation.
The average November return for Bitcoin stands at approximately +34.95%.
Now, that number deserves attention, but it also deserves some context.
An average return is not a promise. It doesn't mean Bitcoin will automaticaly gain 34.95% this month. Historical performance can offer an interesting perspective, but the market doesn't follow a fixed calendar.
Still, I think the contrast between October and November is worth discussing. One month closes in negative territory, while the next enters with a historically strong average return. That naturally creates a question: are we looking at another opportunity for Bitcoin to regain momentum, or is the market entering a period where expectations could become dangerous?
The bigger issue here is how market participants interpret historical data.
When traders see a strong seasonal average, some immediately become optimistic. Others dismiss it completely because past performance cannot guarantee future results.
Personally, I think both reactions miss an important point.
Historical data is useful when it helps us understand market behavior, not when we use it to predict exactly what happens next.
#BinanceReopensWithdrawalsForMoreAssets #AppleReportsMixedResults #BinanceHourlyDepositsExceedWithdrawals $BTC
There is something interesting about how people react to the Bitcoin market. A negative monthly close often changes the entire mood. Suddenly, traders become cautious, investors start questioning their positions, and discussions shift toward how much further the market could fall. But market history has a habit of reminding us that short-term performance and broader market behavior are not always telling the same story.
October ended with a -7.32% return for $BTC . That's not exactly the kind of monthly close bulls wanted to see. It creates uncertainty, especially for people who entered the market expecting another strong continuation.
However, November has historically carried a different reputation.
The average November return for Bitcoin stands at approximately +34.95%.
Now, that number deserves attention, but it also deserves some context.
An average return is not a promise. It doesn't mean Bitcoin will automaticaly gain 34.95% this month. Historical performance can offer an interesting perspective, but the market doesn't follow a fixed calendar.
Still, I think the contrast between October and November is worth discussing. One month closes in negative territory, while the next enters with a historically strong average return. That naturally creates a question: are we looking at another opportunity for Bitcoin to regain momentum, or is the market entering a period where expectations could become dangerous?
The bigger issue here is how market participants interpret historical data.
When traders see a strong seasonal average, some immediately become optimistic. Others dismiss it completely because past performance cannot guarantee future results.
Personally, I think both reactions miss an important point.
Historical data is useful when it helps us understand market behavior, not when we use it to predict exactly what happens next.
#BinanceReopensWithdrawalsForMoreAssets #AppleReportsMixedResults #BinanceHourlyDepositsExceedWithdrawals $BTC