🐕
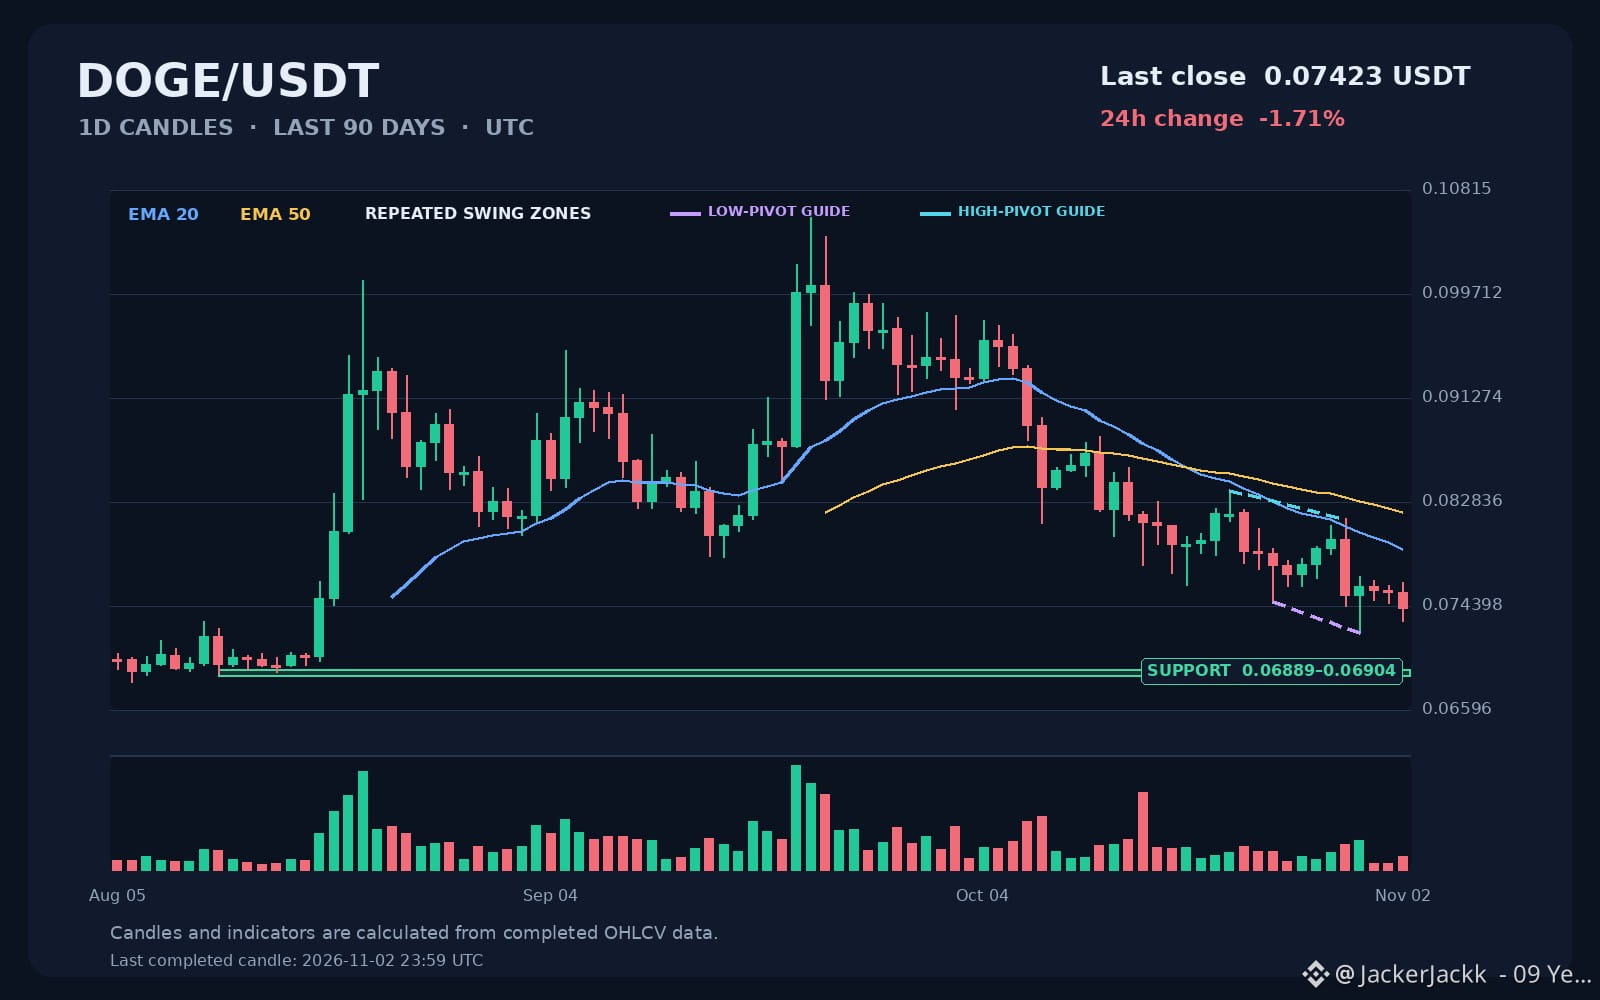
DOGE's last completed daily candle closed at 0.07423 USDT, down 1.71%. Trading volume reached 353,978,150 DOGE.
The close remains below both the 20-day EMA (0.07901) and 50-day EMA (0.08201). With the shorter average below the longer one, the daily trend still favors sellers.
The 0.06889–0.06904 zone is the only repeated horizontal support band identified on the chart, with two touches. DOGE remains above it, but another test would put buyers under pressure.
A daily close below this band would weaken the support scenario. Holding it could provide room for a recovery attempt, although that alone would not confirm a reversal.
The latest falling pivot guides connect lows at 0.07478 and 0.07220, alongside highs at 0.08380 and 0.08148. They suggest downward pressure, but remain provisional rather than confirmed trendlines.
Reclaiming the 20-day EMA, followed by the 50-day EMA, would provide stronger evidence of improving momentum.
For perspective, DOGE's 90-day range extends from 0.06822 to 0.10589 USDT. The latest close sits much closer to the low than the high.
DOGE is still above its repeated support, but below both key moving averages. Buyers need more than a brief bounce to change the daily picture.
DOGE's last completed daily candle closed at 0.07423 USDT, down 1.71%. Trading volume reached 353,978,150 DOGE.
The close remains below both the 20-day EMA (0.07901) and 50-day EMA (0.08201). With the shorter average below the longer one, the daily trend still favors sellers.
The 0.06889–0.06904 zone is the only repeated horizontal support band identified on the chart, with two touches. DOGE remains above it, but another test would put buyers under pressure.
A daily close below this band would weaken the support scenario. Holding it could provide room for a recovery attempt, although that alone would not confirm a reversal.
The latest falling pivot guides connect lows at 0.07478 and 0.07220, alongside highs at 0.08380 and 0.08148. They suggest downward pressure, but remain provisional rather than confirmed trendlines.
Reclaiming the 20-day EMA, followed by the 50-day EMA, would provide stronger evidence of improving momentum.
For perspective, DOGE's 90-day range extends from 0.06822 to 0.10589 USDT. The latest close sits much closer to the low than the high.
DOGE is still above its repeated support, but below both key moving averages. Buyers need more than a brief bounce to change the daily picture.