
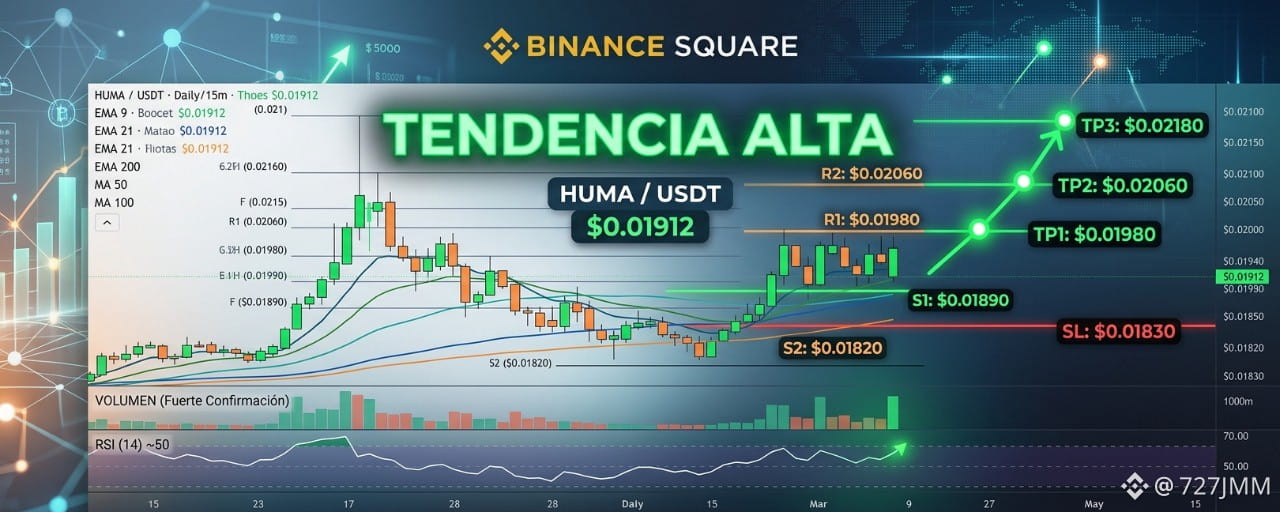


The HUMA/USDT pair shows a solid structure around $0.01912, trading in a clear accumulation phase with a bullish bias. Technical confluence across timeframes (Daily / 15m / 5m) suggests buyers are defending key zones, with buying volume emerging.
Technical Situation Analysis
Moving Average Confluence (EMA/MA): On the daily and 15m charts, the EMA 9 ($0.01895) and EMA 21 ($0.01880) maintain a bullish crossover above the EMA 200 ($0.01820) and the MA 50/100, confirming robust dynamic support and a higher-low structure.
Market Strength & Volume: The RSI (14) on 15m/5m is near 48–52 points, moving out of the cooling zone with no signs of overbought conditions. Volume on green candles supports the validity of the move compared with weak pullbacks.
Trade Setup (Bullish Setup)
Ideal Entry Zone: $0.01890 – $0.01915 (Reload zone above EMA 9/21)
TP1 (Conservative): $0.01980 (Secure profits at immediate resistance)
TP2 (Intermediate): $0.02060 (0.618 Fibonacci extension)
TP3 (Moonshot): $0.02180 (Extended target if it breaks out of the range)
Stop Loss (SL): $0.01830 (Technical invalidation below the EMA 200 and key pullback level)
Trade Rationale: We entered on a bounce from the dynamic support cluster (EMA 9/21 and MA 50), with RSI reset on shorter timeframes (5m/15m). Accumulation at $0.01912 projects momentum toward the liquidity at the upper end of the channel.