$BTC Will this time’s correction finish ahead of schedule?
Post-election pullbacks have narrowed in each of the first three cycles.
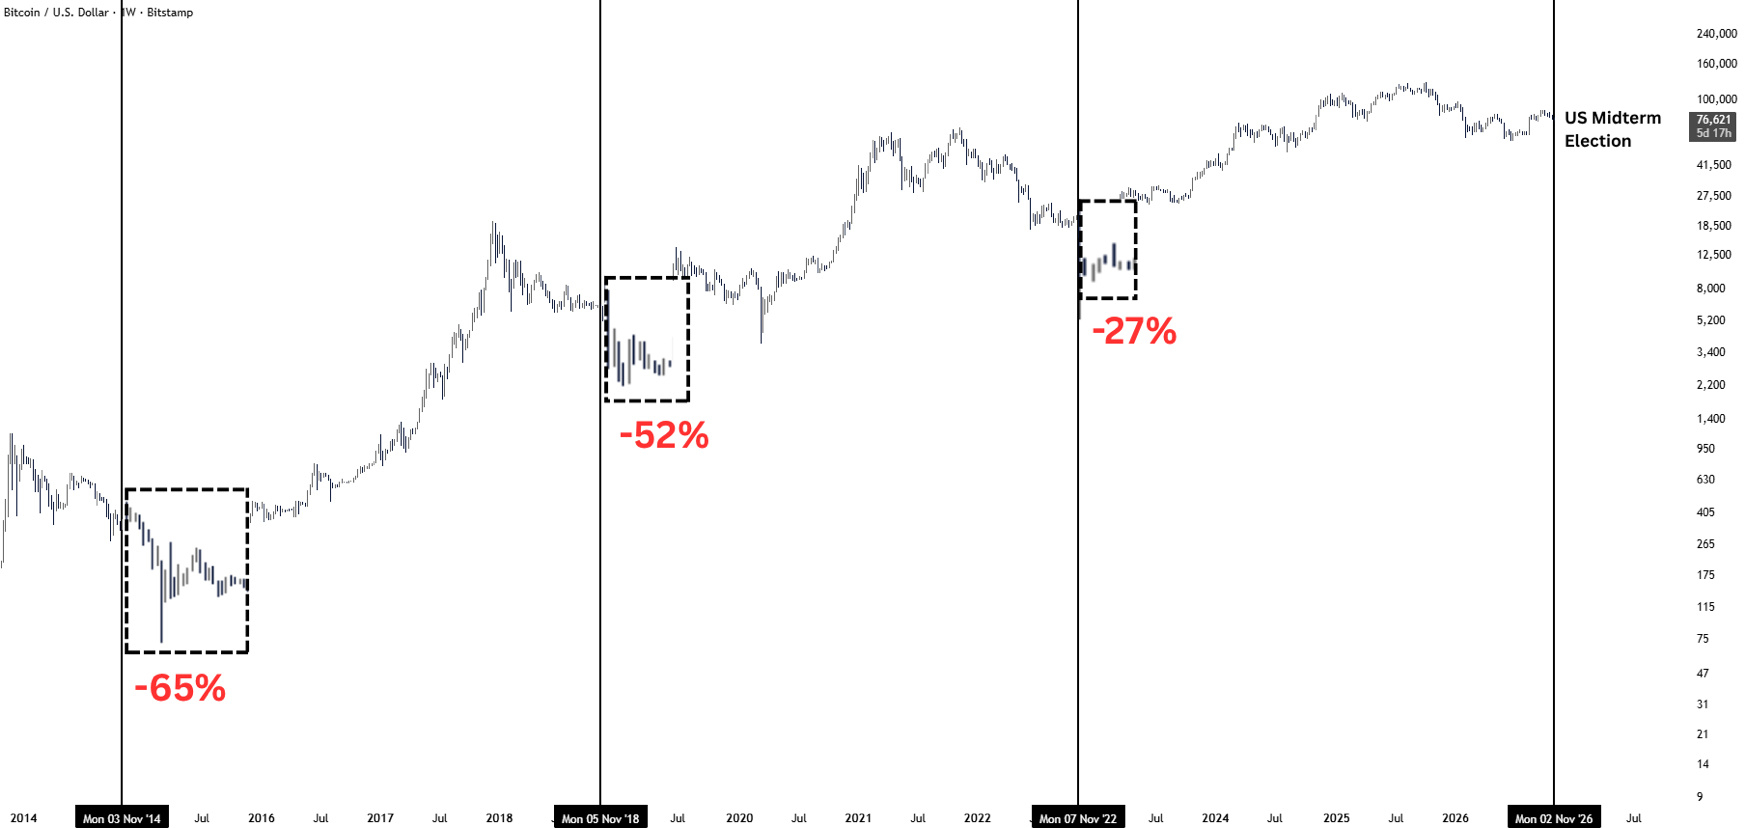
The drops went from 65% to 52%, then to 27%!
Before this vote, prices had already rebounded from their lows.
Can the bulls rewrite the script of post-election declines!
This BTC weekly chart compares price movements after the U.S. midterm elections in 2014, 2018, and 2022. The marked interim pullbacks were 65%, 52%, and 27%—each smaller than the last. Now in 2026, BTC has already undergone a clear correction before the vote, then rebounded from its lows, with the chart showing a price of around $76,621. The key change the market is watching this time is whether an interim low could arrive ahead of the election.
I’m more focused on whether selling pressure after the vote can still push prices lower. If BTC holds above its previous low during a pullback, and subsequent lows gradually move higher, the bulls will have a chance to show that much of this round of selling pressure has already been released early. On the other hand, if the price falls below its previous low again, the “early bottom” thesis will need to be reassessed. Each of the first three cycles had its own market backdrop. The most meaningful signal right now is still whether prices stop falling when bad news hits, and whether incoming buying can push them higher.
If post-election selling pressure fails to drive prices to a new low, the bulls will have more confidence in holding the floor.
Once prices reclaim the resistance above and buyers keep stepping in, there’s a better chance the toughest stretch will be behind us!
Click the card below to get started! 👇
$ETH $ZEC
Post-election pullbacks have narrowed in each of the first three cycles.
The drops went from 65% to 52%, then to 27%!
Before this vote, prices had already rebounded from their lows.
Can the bulls rewrite the script of post-election declines!
This BTC weekly chart compares price movements after the U.S. midterm elections in 2014, 2018, and 2022. The marked interim pullbacks were 65%, 52%, and 27%—each smaller than the last. Now in 2026, BTC has already undergone a clear correction before the vote, then rebounded from its lows, with the chart showing a price of around $76,621. The key change the market is watching this time is whether an interim low could arrive ahead of the election.
I’m more focused on whether selling pressure after the vote can still push prices lower. If BTC holds above its previous low during a pullback, and subsequent lows gradually move higher, the bulls will have a chance to show that much of this round of selling pressure has already been released early. On the other hand, if the price falls below its previous low again, the “early bottom” thesis will need to be reassessed. Each of the first three cycles had its own market backdrop. The most meaningful signal right now is still whether prices stop falling when bad news hits, and whether incoming buying can push them higher.
If post-election selling pressure fails to drive prices to a new low, the bulls will have more confidence in holding the floor.
Once prices reclaim the resistance above and buyers keep stepping in, there’s a better chance the toughest stretch will be behind us!
Click the card below to get started! 👇
$ETH $ZEC