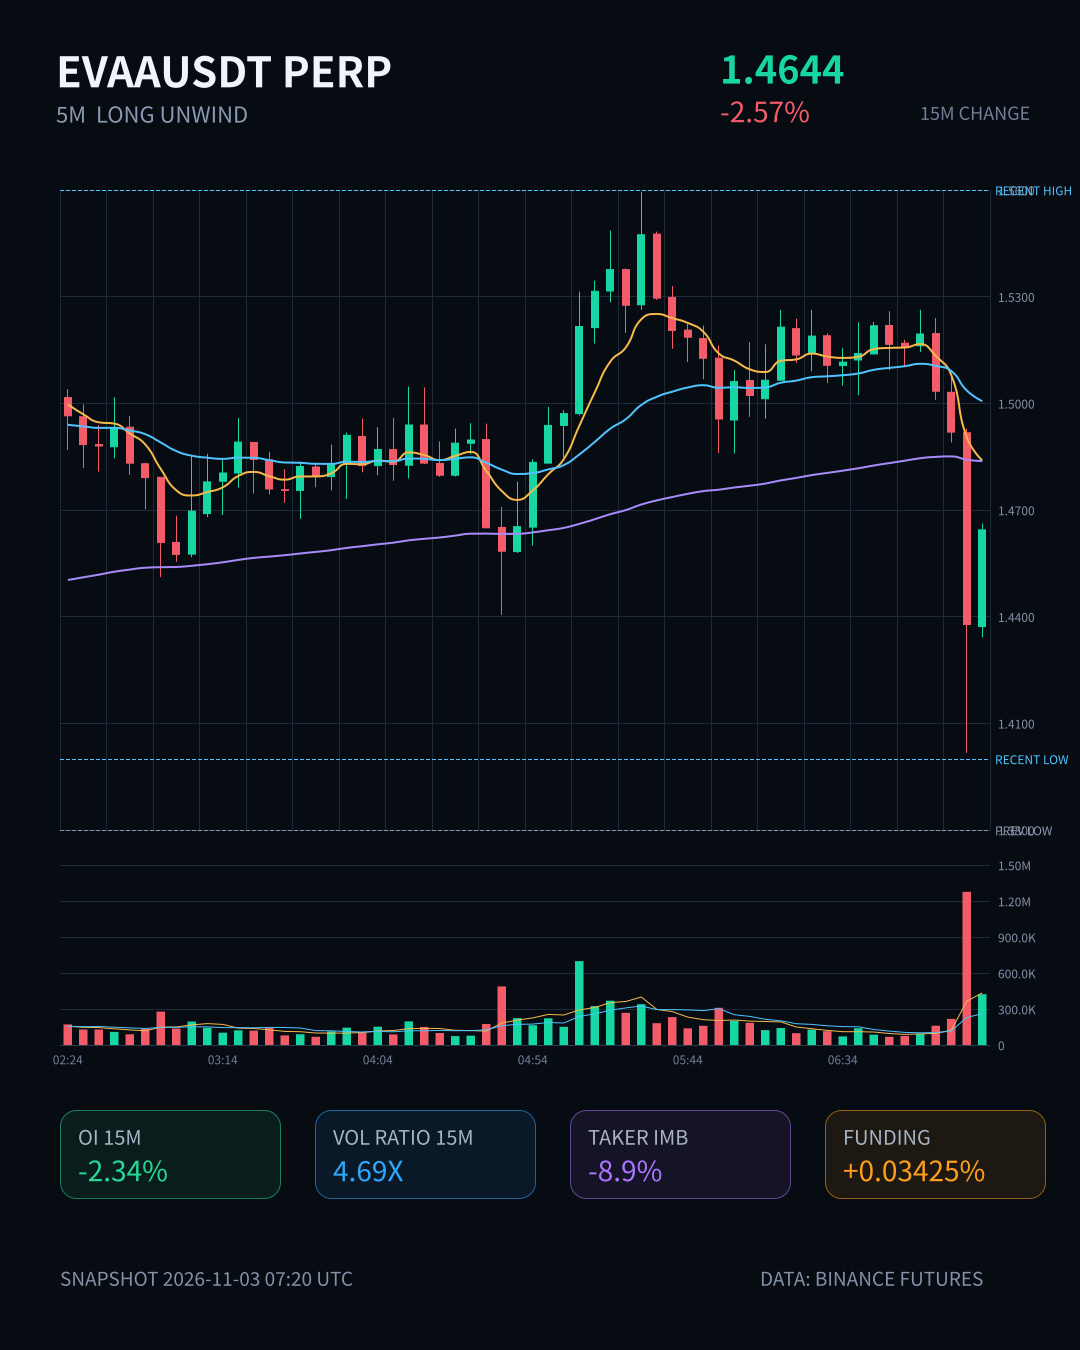
$EVAA has taken a pretty hard hit here, down 2.57% in 15m, with volume surging to 4.69x. But the real thing to watch is OI—down 2.34% in 15m and 1.81% in 1h, with notional changes exceeding 1.1M USDT in both cases. Its anomaly percentile is 99.8%, ranking #3 across the entire pool.
Price falling alongside OI is a classic sign of long deleveraging, with stop-losses being triggered and positions shrinking at the same time. The taker volume delta is -8.9%, and the buy/sell ratio is 0.84, so selling pressure is in control.
OI anomalies have persisted across multiple timeframes, so this can't be explained by a single wick. The 24h trading volume of 95.95M USDT is no small amount, which suggests this isn't a liquidity issue—positions are genuinely being flushed out.
The key now is whether OI can stabilize. Don't rush to buy the dip before the leverage has been flushed out.
Price falling alongside OI is a classic sign of long deleveraging, with stop-losses being triggered and positions shrinking at the same time. The taker volume delta is -8.9%, and the buy/sell ratio is 0.84, so selling pressure is in control.
OI anomalies have persisted across multiple timeframes, so this can't be explained by a single wick. The 24h trading volume of 95.95M USDT is no small amount, which suggests this isn't a liquidity issue—positions are genuinely being flushed out.
The key now is whether OI can stabilize. Don't rush to buy the dip before the leverage has been flushed out.