$ADA **ADA/USDT (1H) – Quick Analysis**
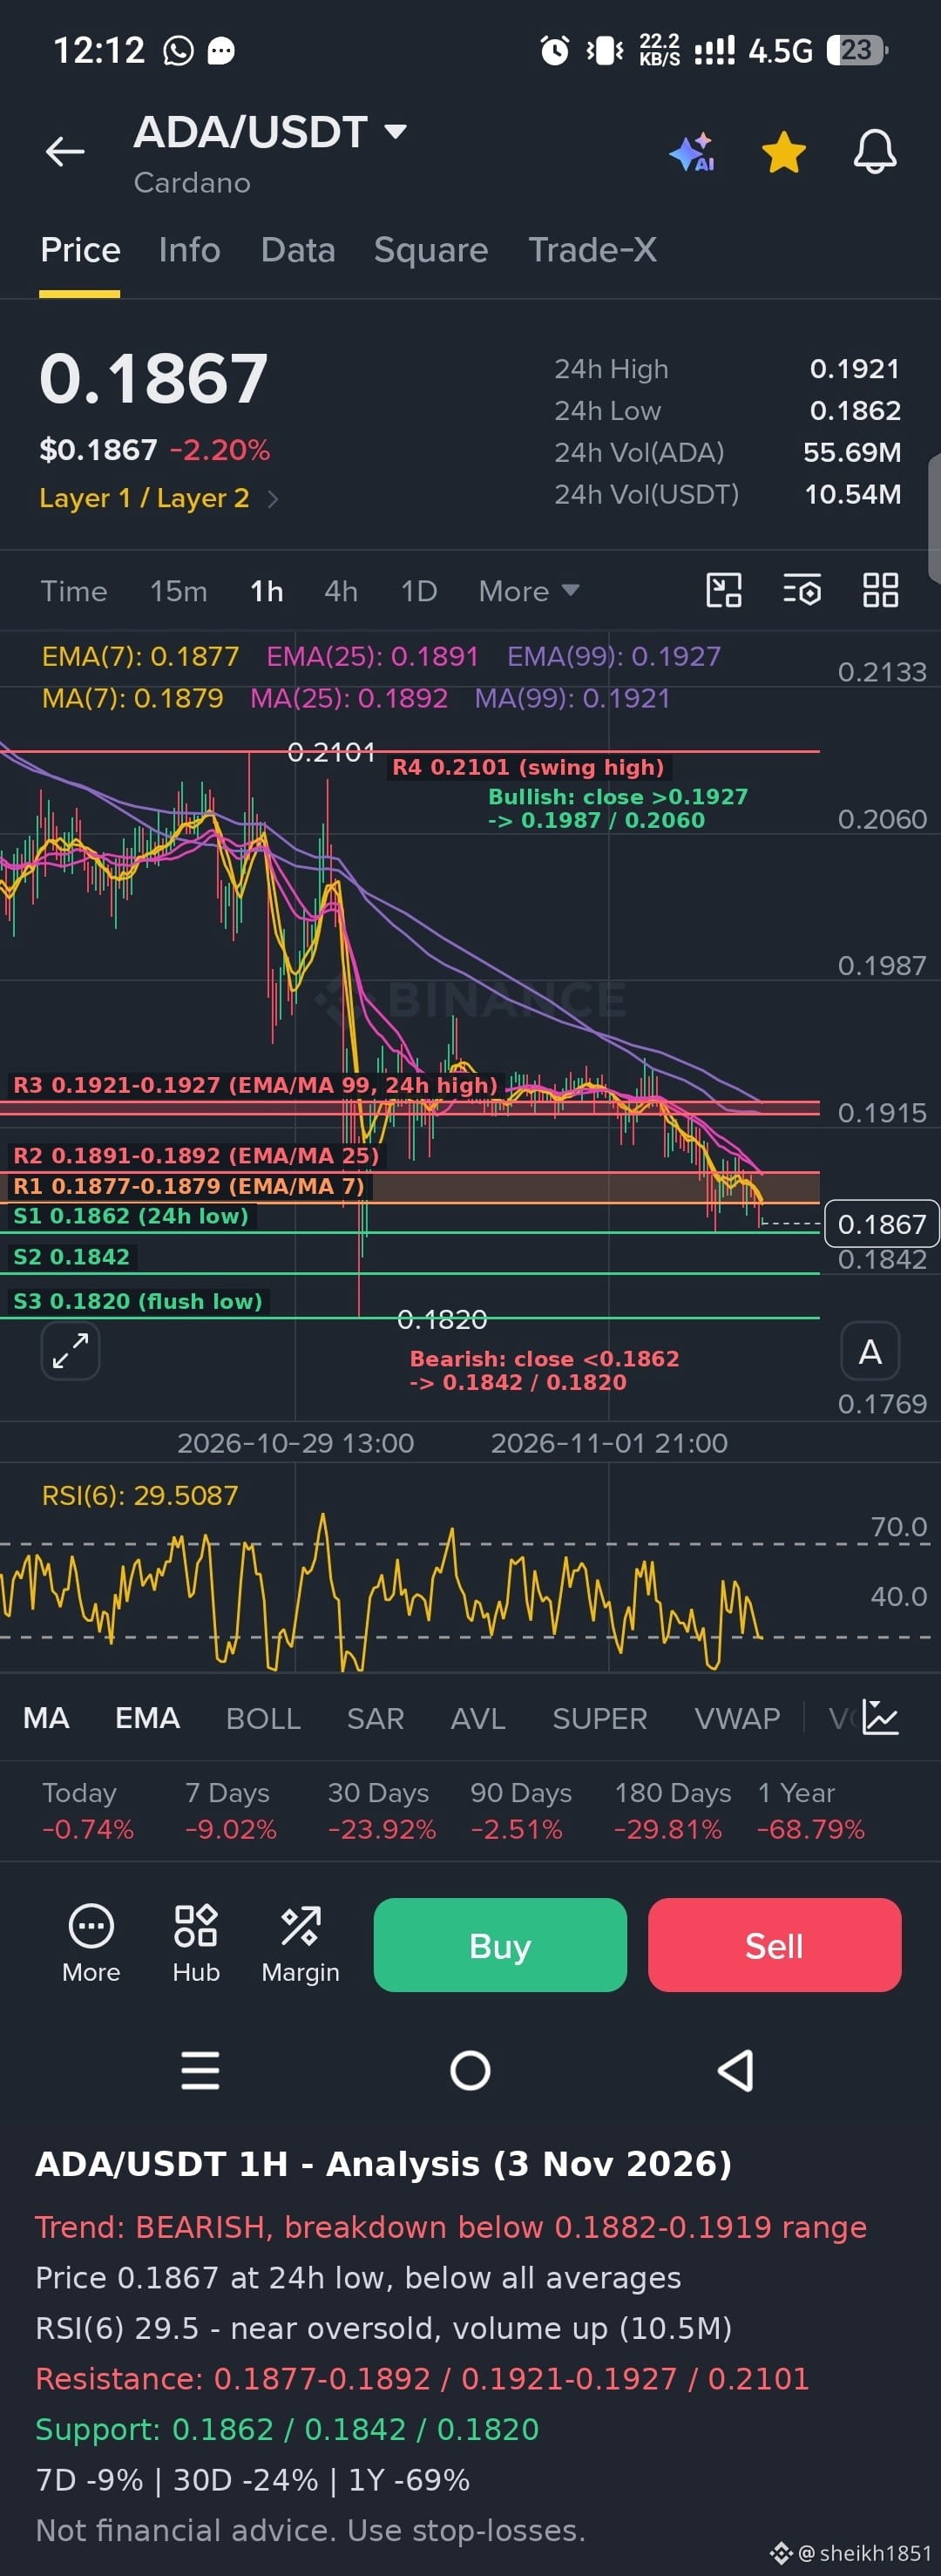
**Trend:** Bearish, and the breakdown I flagged in your last ADA screenshot has played out. Price (0.1867) has slipped out of the 0.192 to 0.194 range, lost 0.1919 and the 0.1882 level, and is now sitting at the 24h low of 0.1862. It is below every moving average: EMA(7) 0.1877, EMA(25) 0.1891 and EMA(99) 0.1927, with MA(99) at 0.1921, and all of them are sloping down. The candles keep making lower highs and lower lows. Over longer periods it is down about 9% over 7 days, 24% over 30 days and 69% over one year.
**Momentum:** RSI(6) is about 29.5, which is close to oversold. That raises the chance of a relief bounce, but in a steady downtrend RSI can stay low for a while. Volume is higher than in your last screenshot (about 10.5M USDT versus 6M), which shows more selling pressure behind this move.
**Key levels:**
- **Resistance:** 0.1877 to 0.1879 (EMA/MA 7), then 0.1891 to 0.1892 (EMA/MA 25), then 0.1921 to 0.1927 (the 99 averages and the 24h high).
- **Support:** 0.1862 (24h low), then 0.1842, then 0.1820 (the earlier flush low). Below that, the chart bottom is near 0.1769.
**Outlook:** The bias stays bearish while price is under 0.1891. A relief bounce into 0.1877 to 0.1892 is the likeliest near-term move, and that zone would probably act as resistance. A 1H close below 0.1862 would put 0.1842 and then 0.1820 in play, and losing 0.1820 would open further downside. A bullish shift needs a 1H close back above 0.1927 with rising volume.
This is a technical read not financial advice. Use stop-losses and keep position sizes small.
#USMidtermElections #Binance
**Trend:** Bearish, and the breakdown I flagged in your last ADA screenshot has played out. Price (0.1867) has slipped out of the 0.192 to 0.194 range, lost 0.1919 and the 0.1882 level, and is now sitting at the 24h low of 0.1862. It is below every moving average: EMA(7) 0.1877, EMA(25) 0.1891 and EMA(99) 0.1927, with MA(99) at 0.1921, and all of them are sloping down. The candles keep making lower highs and lower lows. Over longer periods it is down about 9% over 7 days, 24% over 30 days and 69% over one year.
**Momentum:** RSI(6) is about 29.5, which is close to oversold. That raises the chance of a relief bounce, but in a steady downtrend RSI can stay low for a while. Volume is higher than in your last screenshot (about 10.5M USDT versus 6M), which shows more selling pressure behind this move.
**Key levels:**
- **Resistance:** 0.1877 to 0.1879 (EMA/MA 7), then 0.1891 to 0.1892 (EMA/MA 25), then 0.1921 to 0.1927 (the 99 averages and the 24h high).
- **Support:** 0.1862 (24h low), then 0.1842, then 0.1820 (the earlier flush low). Below that, the chart bottom is near 0.1769.
**Outlook:** The bias stays bearish while price is under 0.1891. A relief bounce into 0.1877 to 0.1892 is the likeliest near-term move, and that zone would probably act as resistance. A 1H close below 0.1862 would put 0.1842 and then 0.1820 in play, and losing 0.1820 would open further downside. A bullish shift needs a 1H close back above 0.1927 with rising volume.
This is a technical read not financial advice. Use stop-losses and keep position sizes small.
#USMidtermElections #Binance