BTC at $76,500—can you still handle it?
Binance loses $6.3 billion, ETFs bleed for two straight weeks, institutions are running—but BTC is still moving sideways at $76,500. This isn’t a sign of stability; it’s the eerie calm before the storm. Can your long position make it through tonight?
First, look at the surface: the price hasn’t collapsed, but the bleeding hasn’t stopped.
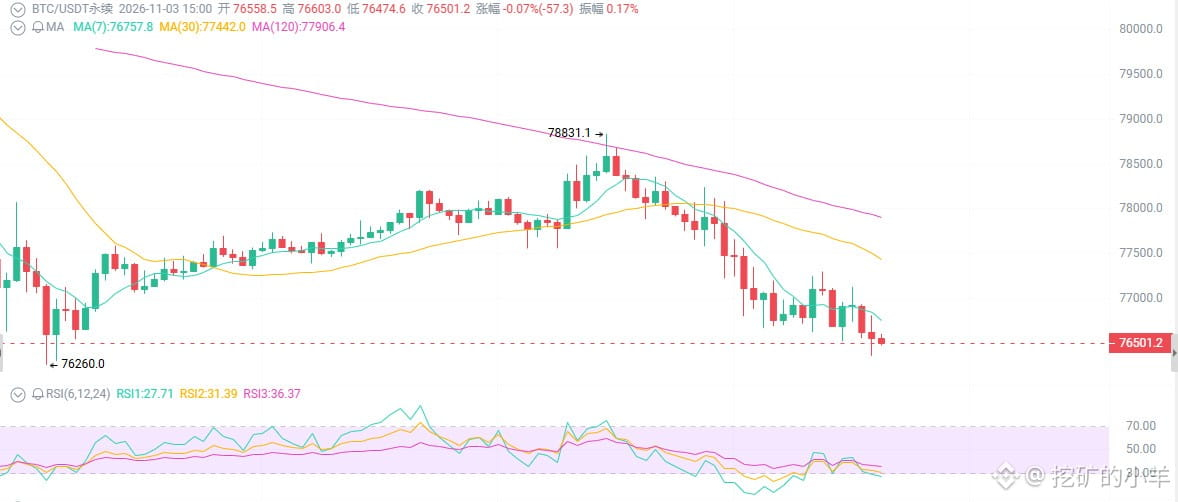
Over the past two weeks, BTC has steadily slid from $81,000 to $76,500, down 6%. October was the worst October in nearly 12 years. Daily candles have closed lower for several sessions in a row, the price is below the moving averages, the RSI is weak, and the MACD has made a death cross—the technical picture is telling you that bears are still in control.
First: Binance’s $6.3 billion hack isn’t gossip—it’s a crisis of trust.
Binance suffered a major incident—a security breach worth around $6.3 billion, attributed to North Korea-linked groups. Users rushed to withdraw funds, the FBI got involved, and part of the SAFU fund was used.
You might say, “Binance can afford to pay it back. What’s there to worry about?”
It’s not whether they can afford to pay it back. It’s trust.
When an exchange gets hacked, institutional risk-management teams reassess “crypto custody risk.” Why are ETF funds flowing out? This is part of the reason—institutions aren’t afraid of volatility; they’re afraid of not knowing “who actually holds my coins.”
Second: ETFs are bleeding, institutions are retreating—don’t pretend you can’t see it.
On October 30, U.S. spot BTC ETFs saw net outflows of $643 million in a single day. On November 2, another $399 million flowed out. Over the whole of October, ETFs shifted from net inflows to net outflows.
In plain English: institutions are selling.
MicroStrategy is still buying? They have conviction—and firepower. What do you have?
All you have is the belief that “BTC will come back up,” and a leveraged position that could be liquidated at any moment.
The Fear & Greed Index fell from greed to 36—leaning toward fear.
When panic sets in, smart money starts positioning itself. But can you tell whether you’re smart money—or the one being positioned against?
Third: $76,500 is a make-or-break level. This is no joke.
Strong support: $75,500–$76,500. This is a zone where recent lows have clustered, and it’s also near the possible 100-day moving average.
If it breaks below, the next levels to watch are $74,000–$75,000, or even lower.
Resistance above: $77,000–$78,000. If it can’t get above that range, every bounce is an opportunity to escape.
Higher up: $79,500–$81,000—a former support zone turned resistance, and an area of heavy trading volume.
Binance loses $6.3 billion, ETFs bleed for two straight weeks, institutions are running—but BTC is still moving sideways at $76,500. This isn’t a sign of stability; it’s the eerie calm before the storm. Can your long position make it through tonight?
First, look at the surface: the price hasn’t collapsed, but the bleeding hasn’t stopped.
Over the past two weeks, BTC has steadily slid from $81,000 to $76,500, down 6%. October was the worst October in nearly 12 years. Daily candles have closed lower for several sessions in a row, the price is below the moving averages, the RSI is weak, and the MACD has made a death cross—the technical picture is telling you that bears are still in control.
First: Binance’s $6.3 billion hack isn’t gossip—it’s a crisis of trust.
Binance suffered a major incident—a security breach worth around $6.3 billion, attributed to North Korea-linked groups. Users rushed to withdraw funds, the FBI got involved, and part of the SAFU fund was used.
You might say, “Binance can afford to pay it back. What’s there to worry about?”
It’s not whether they can afford to pay it back. It’s trust.
When an exchange gets hacked, institutional risk-management teams reassess “crypto custody risk.” Why are ETF funds flowing out? This is part of the reason—institutions aren’t afraid of volatility; they’re afraid of not knowing “who actually holds my coins.”
Second: ETFs are bleeding, institutions are retreating—don’t pretend you can’t see it.
On October 30, U.S. spot BTC ETFs saw net outflows of $643 million in a single day. On November 2, another $399 million flowed out. Over the whole of October, ETFs shifted from net inflows to net outflows.
In plain English: institutions are selling.
MicroStrategy is still buying? They have conviction—and firepower. What do you have?
All you have is the belief that “BTC will come back up,” and a leveraged position that could be liquidated at any moment.
The Fear & Greed Index fell from greed to 36—leaning toward fear.
When panic sets in, smart money starts positioning itself. But can you tell whether you’re smart money—or the one being positioned against?
Third: $76,500 is a make-or-break level. This is no joke.
Strong support: $75,500–$76,500. This is a zone where recent lows have clustered, and it’s also near the possible 100-day moving average.
If it breaks below, the next levels to watch are $74,000–$75,000, or even lower.
Resistance above: $77,000–$78,000. If it can’t get above that range, every bounce is an opportunity to escape.
Higher up: $79,500–$81,000—a former support zone turned resistance, and an area of heavy trading volume.