#技术分析 $ZEC This price action is pretty interesting.
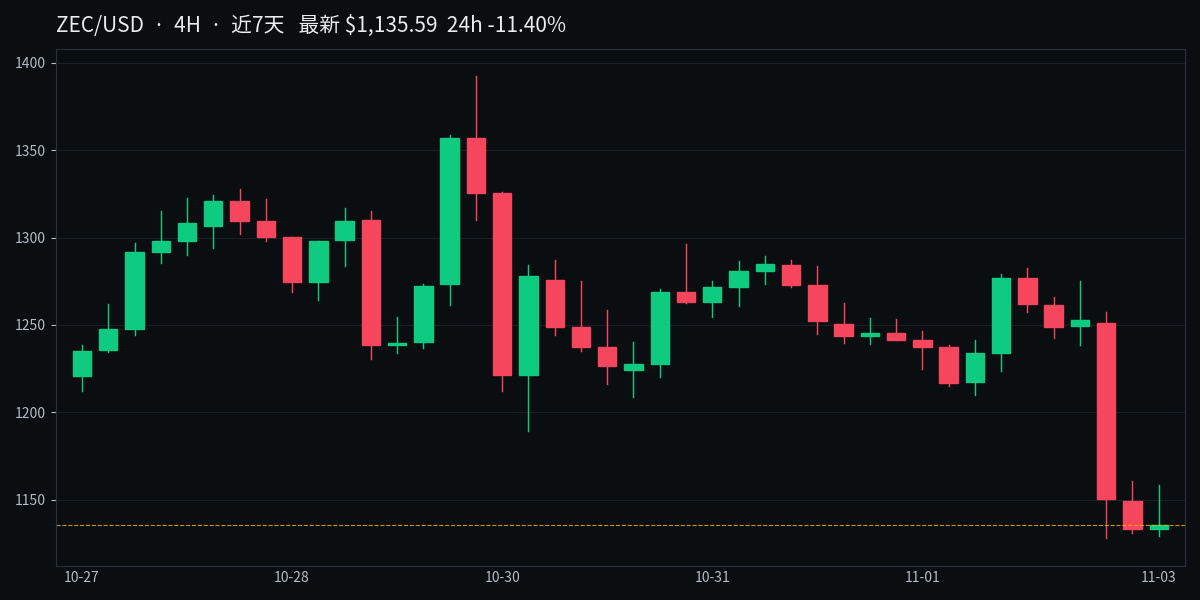
It was still around 1392 seven days ago; now it's at 1129, down 11% in just 24 hours. The highs have been getting lower all the way down: 1283, 1275, 1257—each one lower than the last.
Yesterday, after breaking below the 1250 consolidation zone, it plunged in one big bearish candle to 1130. Now it's moving sideways near the seven-day low of 1128, with the RSI around 25—deep in oversold territory.
There are two ways this could go from here: if it holds above 1128 and climbs back above 1150, this sideways action near the lows could set up a double-bottom rebound. But if 1128 gives way, the price action could open up more room to fall.
It was still around 1392 seven days ago; now it's at 1129, down 11% in just 24 hours. The highs have been getting lower all the way down: 1283, 1275, 1257—each one lower than the last.
Yesterday, after breaking below the 1250 consolidation zone, it plunged in one big bearish candle to 1130. Now it's moving sideways near the seven-day low of 1128, with the RSI around 25—deep in oversold territory.
There are two ways this could go from here: if it holds above 1128 and climbs back above 1150, this sideways action near the lows could set up a double-bottom rebound. But if 1128 gives way, the price action could open up more room to fall.