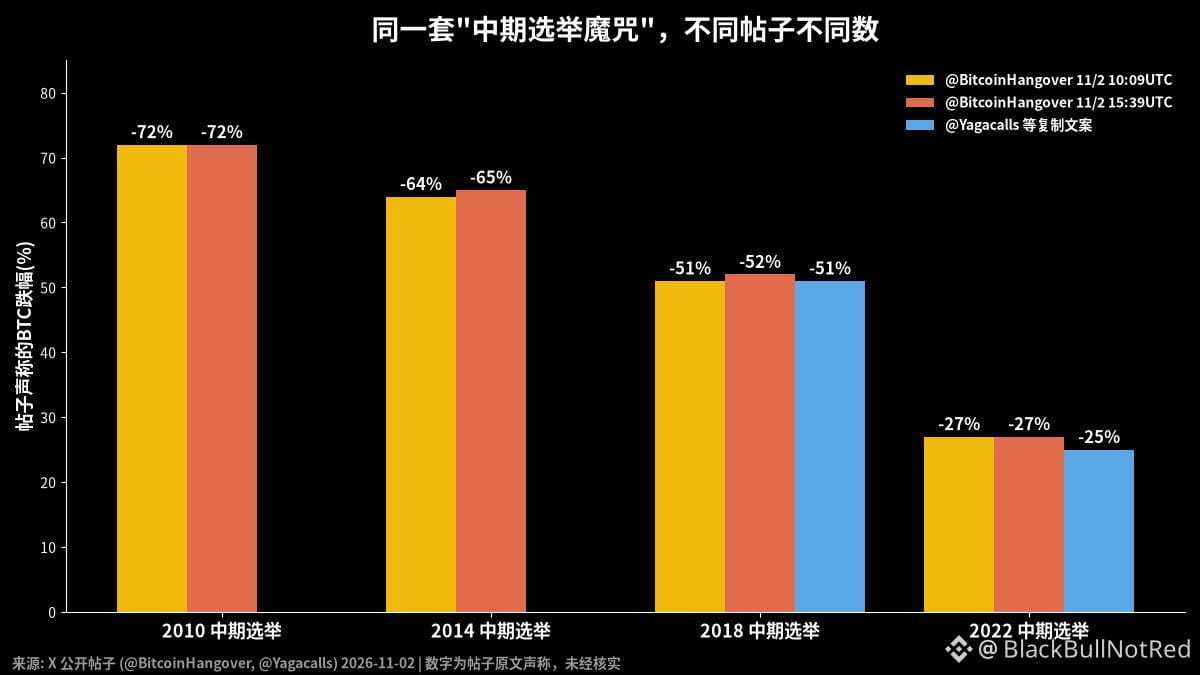
Tomorrow is the US midterm election, and people on X have already started mass-copying the same line: “BTC fell 51% after the 2018 midterms and 25% in 2022. Will BTC drop again, or is this time different?” I checked, and at least three accounts posted it word for word—even the closing question was identical.
The numbers don’t even agree with themselves. The same account, @BitcoinHangover, posted twice on the same day: the first post said 2014 was -64% and 2018 was -51%; a few hours later, it was -65% and -52%. They also casually threw in -72% for 2010. Only a handful of people were trading Bitcoin in 2010—does that really count as a data point?
The logic itself is even more ridiculous. Midterm elections happen every four years, and so do halvings. 2014, 2018, and 2022 all happened to fall in bear-market years in the cycle. Using elections to explain cycle lows is like using World Cup years to explain them: both happen every four years, and the dates just happen to line up. Connecting three dots and calling it a pattern is just reading into a chart.
Kev_Capital_TA’s post was at least reasonably put together: the lows in the last three bear markets all came within 10 weeks of the election. The 2014 low of $178 came 71 days later, and the 2018 low of $3,237 came 39 days later. But that’s matching the lows to the election date after the fact—not evidence that the election caused those lows.
There are people hyping the opposite view, too. @bariksis says BTC is down 12% year to date in midterm election years, Q3—supposedly the weakest quarter—actually rose, and Q4 is making higher lows: “this time is certainly not different”. Both sides are using the same calendar to tell the story they want.
Volatility does tick up around elections, and there really are people hedging in the options market. But posts claiming “it always drops by half after the election” are just engagement bait. If you’re actually trading, watch ETF flows and liquidation levels—not the calendar.
#BTC #USMidtermElections
The numbers don’t even agree with themselves. The same account, @BitcoinHangover, posted twice on the same day: the first post said 2014 was -64% and 2018 was -51%; a few hours later, it was -65% and -52%. They also casually threw in -72% for 2010. Only a handful of people were trading Bitcoin in 2010—does that really count as a data point?
The logic itself is even more ridiculous. Midterm elections happen every four years, and so do halvings. 2014, 2018, and 2022 all happened to fall in bear-market years in the cycle. Using elections to explain cycle lows is like using World Cup years to explain them: both happen every four years, and the dates just happen to line up. Connecting three dots and calling it a pattern is just reading into a chart.
Kev_Capital_TA’s post was at least reasonably put together: the lows in the last three bear markets all came within 10 weeks of the election. The 2014 low of $178 came 71 days later, and the 2018 low of $3,237 came 39 days later. But that’s matching the lows to the election date after the fact—not evidence that the election caused those lows.
There are people hyping the opposite view, too. @bariksis says BTC is down 12% year to date in midterm election years, Q3—supposedly the weakest quarter—actually rose, and Q4 is making higher lows: “this time is certainly not different”. Both sides are using the same calendar to tell the story they want.
Volatility does tick up around elections, and there really are people hedging in the options market. But posts claiming “it always drops by half after the election” are just engagement bait. If you’re actually trading, watch ETF flows and liquidation levels—not the calendar.
#BTC #USMidtermElections