

◆━━━━━━━━━━━━━━━━━━━━
MARKET OVERVIEW
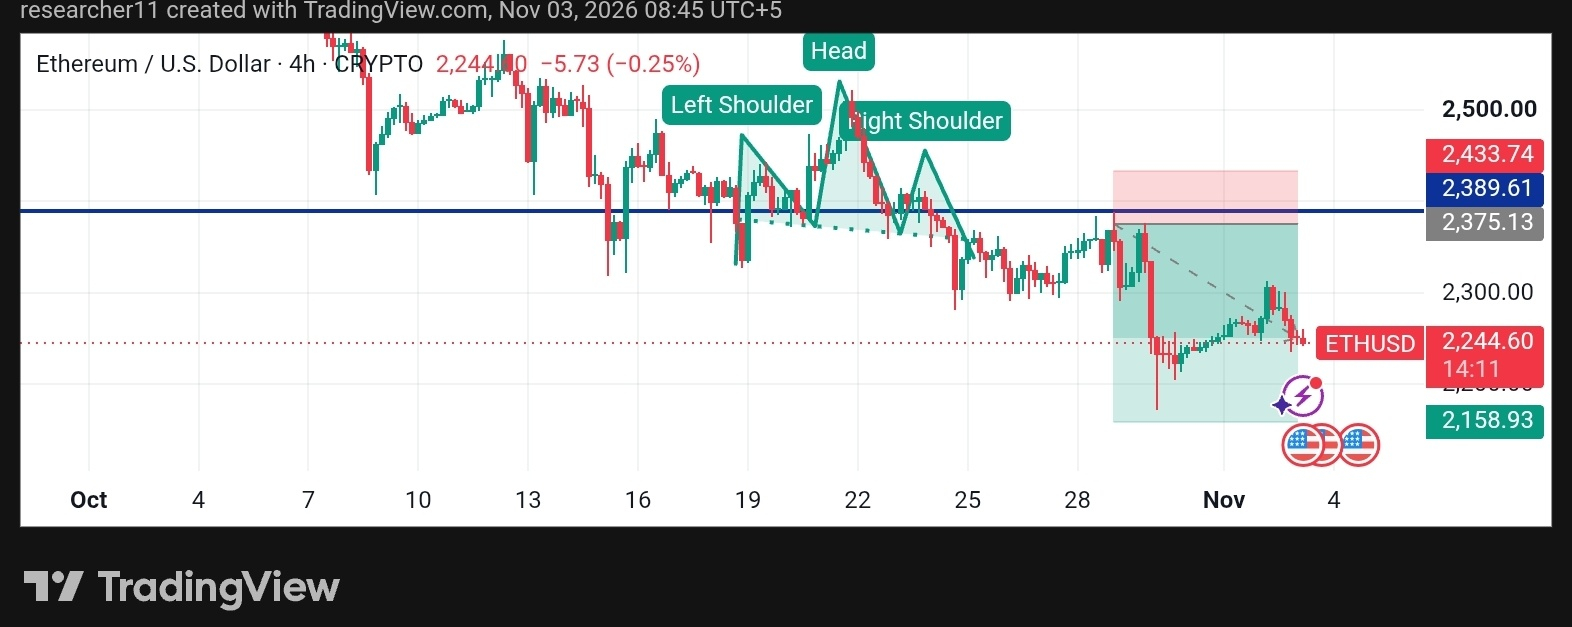
Ethereum is trading near $2,244 on the 4H chart, keeping a clear bearish tone. After failing to hold the $2,380 area, ETH dropped sharply and has since made only a modest recovery. Volatility has cooled, but sellers still have the upper hand.
◆━━━━━━━━━━━━━━━━━━━━
TECHNICAL ANALYSIS
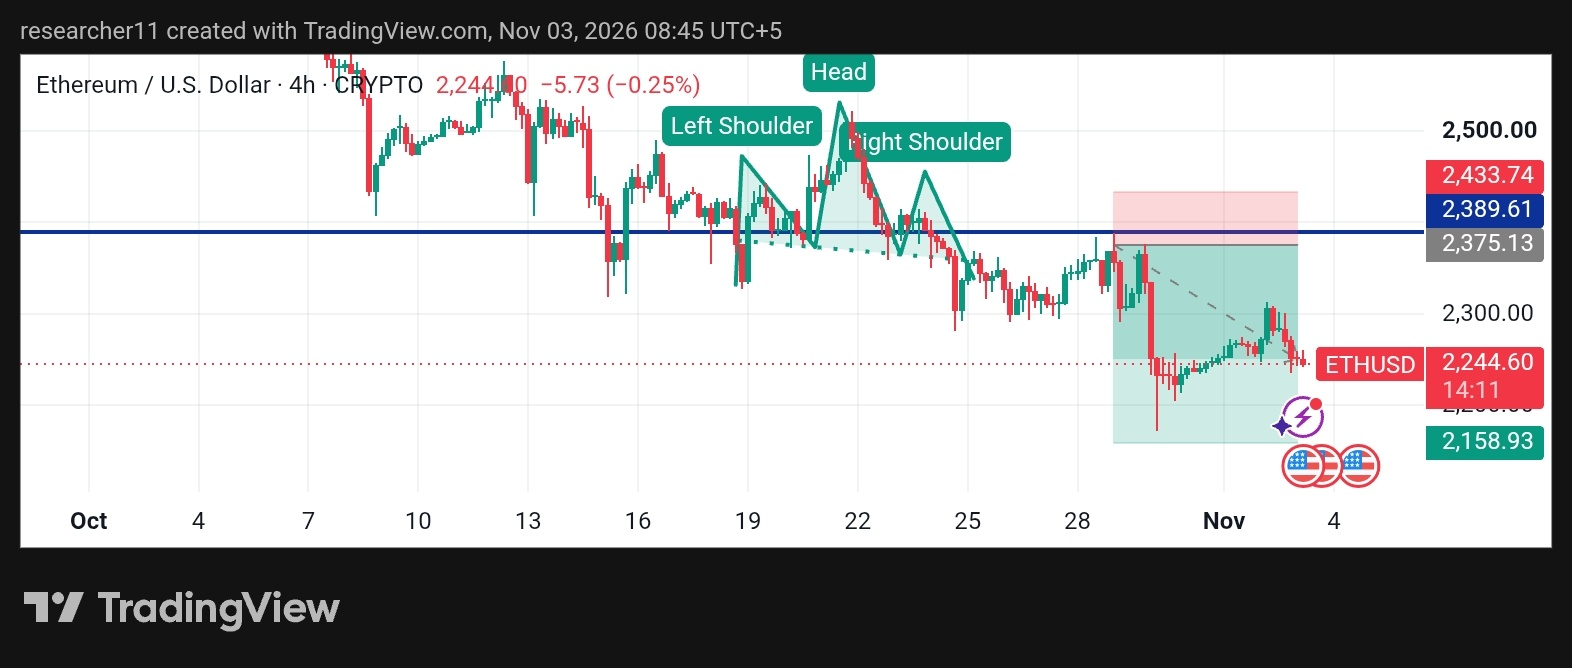
ETH formed a visible Head and Shoulders pattern in October. The left shoulder, head and right shoulder built up around the $2,400–$2,500 zone, followed by a break below the neckline near $2,380.
Price retested that area, and the retest failed. The bounce stalled near $2,310 and rolled over, keeping the lower-high sequence intact. This kind of break-and-retest behavior is a typical confirmation of the pattern.
The $2,300 area has now turned into short-term resistance, while $2,160 is the key downside area, where the last sharp drop found buyers.
◆━━━━━━━━━━━━━━━━━━━━
SCENARIO ANALYSIS
🟢 Bullish Case: ETH needs to reclaim $2,300 and then push above the $2,375–$2,390 neckline zone on a 4H close. That would weaken the pattern and suggest a failed breakdown.
🔴 Bearish Case: A 4H close below $2,200 could bring $2,159 back into focus. Losing that level would extend the bearish structure.
⚪ Neutral Case: ETH may range between $2,160 and $2,310 while the market digests the move.
◆━━━━━━━━━━━━━━━━━━━━
KEY LEVELS
🔺 Resistance: R1 $2,300 | R2 $2,375 | R3 $2,434
🔻 Support: S1 $2,200 | S2 $2,159
◆━━━━━━━━━━━━━━━━━━━━
MARKET CONTEXT
ETH is moving in step with Bitcoin. If BTC loses its support, ETH could face extra pressure. A BTC recovery would likely help ETH test resistance.
◆━━━━━━━━━━━━━━━━━━━━
OUTLOOK
Traders should watch $2,300 as a resistance test and $2,159 as the key support. Patience and confirmation matter more than prediction here.
◆━━━━━━━━━━━━━━━━━━━━
⚠️ This is market analysis, not financial advice. Always do your own research.
#Ethereum #BinanceReopensWithdrawalsForMoreAssets #USMidtermElections #BinanceWithdrawalScamWarning $ETH
