I know it’s been a while since I last posted a Bitcoin chart for you 😁
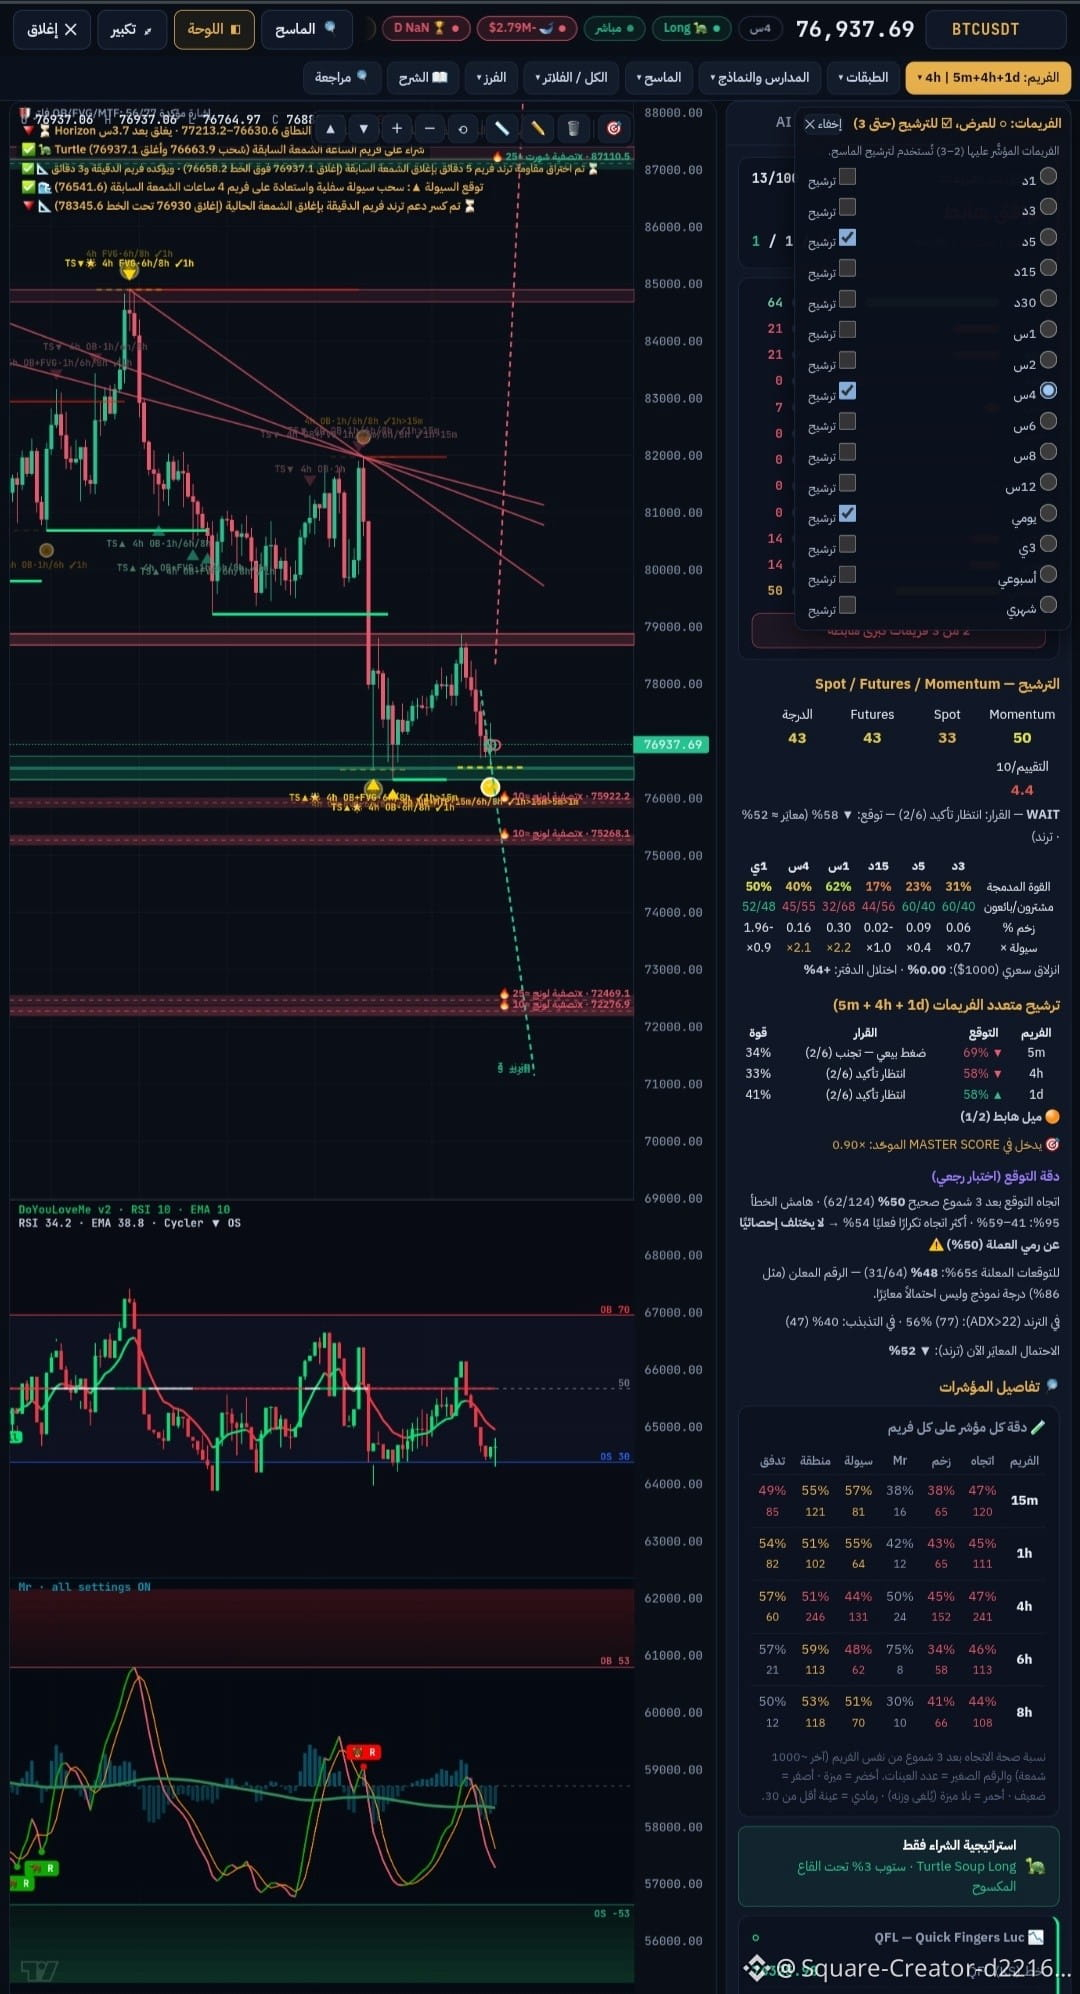
But today, the smart technical chart gave me a bullish signal at a zone it had identified for us earlier. We traded it and got a nice bounce 🎯 despite the bad news$BTC
Bitcoin is now facing an important test and needs to hold this zone, because losing it could open the door to lower price levels.
And the best part is that you can watch the smart technical chart analyze price movements and show you areas of strength and weakness, as well as support and resistance levels—without having to ask an analyst every time.
Over time, you’ll start learning from it how to read the chart yourself, understand price behavior, and connect the signals.
It’s not just a tool that gives you analysis; it’s a tool that helps you develop your market perspective and learn to read charts 💎🔥
$SUI
#Market_Update #btc70k
But today, the smart technical chart gave me a bullish signal at a zone it had identified for us earlier. We traded it and got a nice bounce 🎯 despite the bad news$BTC
Bitcoin is now facing an important test and needs to hold this zone, because losing it could open the door to lower price levels.
And the best part is that you can watch the smart technical chart analyze price movements and show you areas of strength and weakness, as well as support and resistance levels—without having to ask an analyst every time.
Over time, you’ll start learning from it how to read the chart yourself, understand price behavior, and connect the signals.
It’s not just a tool that gives you analysis; it’s a tool that helps you develop your market perspective and learn to read charts 💎🔥
$SUI
#Market_Update #btc70k