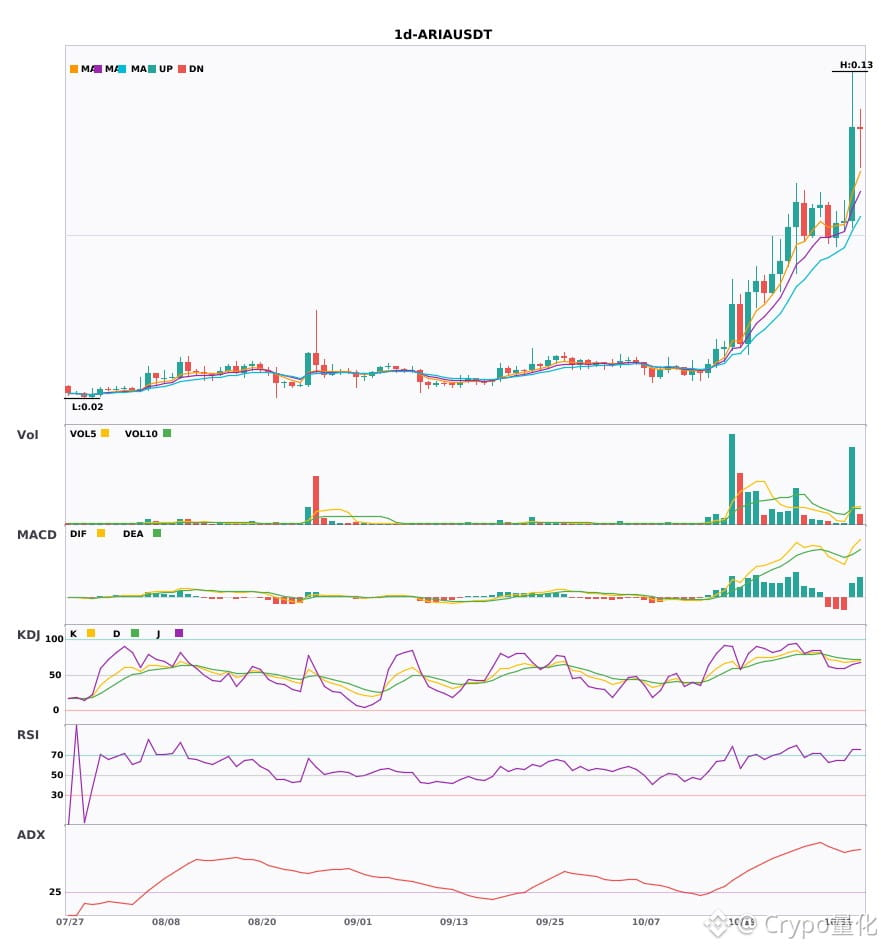
$ARIA Daily chart is bullish, with key indicators confirming 🔥
════════════════════
🔴 $ARIA Daily chart bullish signal
⚠️Technical analysis: ADX(71) indicates a very strong trend (watch out for an overheated pullback) | MACD golden cross above zero, bullish momentum released | EMA5 > EMA8 > EMA13, bullish alignment | KDJ is running strong, bulls have the upper hand (K is 69.4, D is 71.6) | Volume surged (4.7x)
════════════════════
🔔 Follow to get the latest market moves first 🔔
#技术分析 #ARIA
📌 When trading, pay attention to whether the candlestick pattern is appropriate
════════════════════
🔴 $ARIA Daily chart bullish signal
⚠️Technical analysis: ADX(71) indicates a very strong trend (watch out for an overheated pullback) | MACD golden cross above zero, bullish momentum released | EMA5 > EMA8 > EMA13, bullish alignment | KDJ is running strong, bulls have the upper hand (K is 69.4, D is 71.6) | Volume surged (4.7x)
════════════════════
🔔 Follow to get the latest market moves first 🔔
#技术分析 #ARIA
📌 When trading, pay attention to whether the candlestick pattern is appropriate