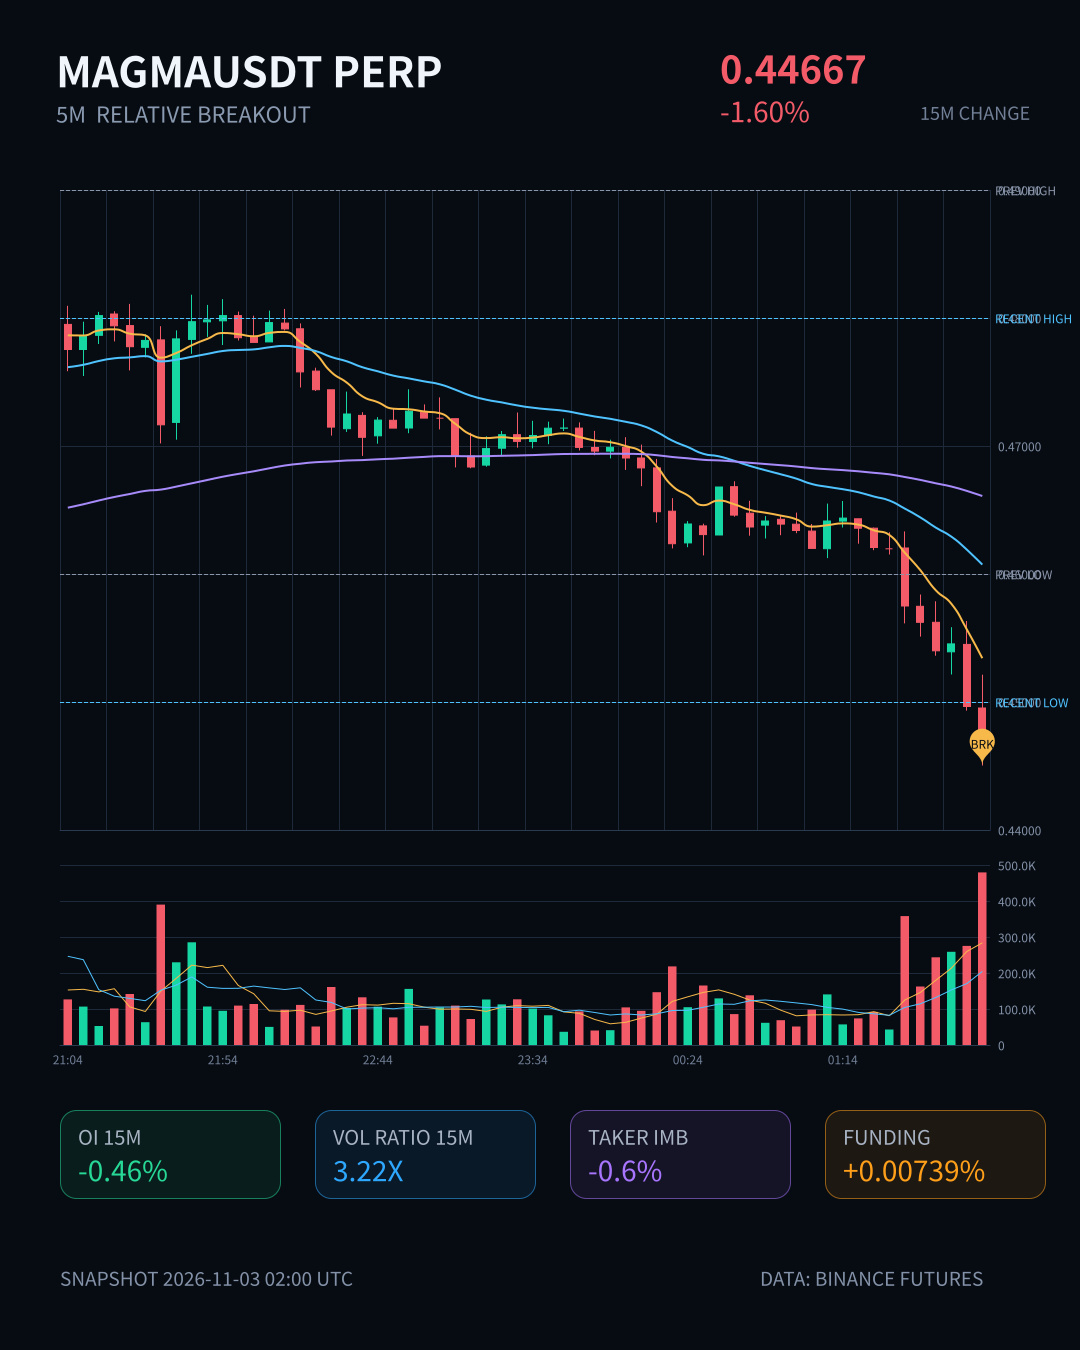
$MAGMA has something interesting going on on the 15m chart. The price is down 1.6%, which isn't much, but volume has jumped straight to 3.22x. OI is down 1.24% in an hour, with over 440K U in notional traded—a classic long liquidation, not spot selling. The OI anomaly percentile is 95.8%, ranking #3 across the whole pool. This kind of deleveraging over several consecutive periods is more worth watching than a simple dump.
It just broke below the low of the last 20 5m candles. The buy/sell ratio is still at 0.99, and the aggressive trade imbalance is -0.6%. Selling pressure hasn't reached panic levels; this looks more like stop-loss orders getting swept. 24h volume is only a little over 24M, and liquidity isn't particularly deep. Don't chase a short at this level—wait for OI to stabilize, then see whether there's a bounce. Structure only emerges once the leverage has been cleared.
It just broke below the low of the last 20 5m candles. The buy/sell ratio is still at 0.99, and the aggressive trade imbalance is -0.6%. Selling pressure hasn't reached panic levels; this looks more like stop-loss orders getting swept. 24h volume is only a little over 24M, and liquidity isn't particularly deep. Don't chase a short at this level—wait for OI to stabilize, then see whether there's a bounce. Structure only emerges once the leverage has been cleared.