
11.3 BTC Market Analysis
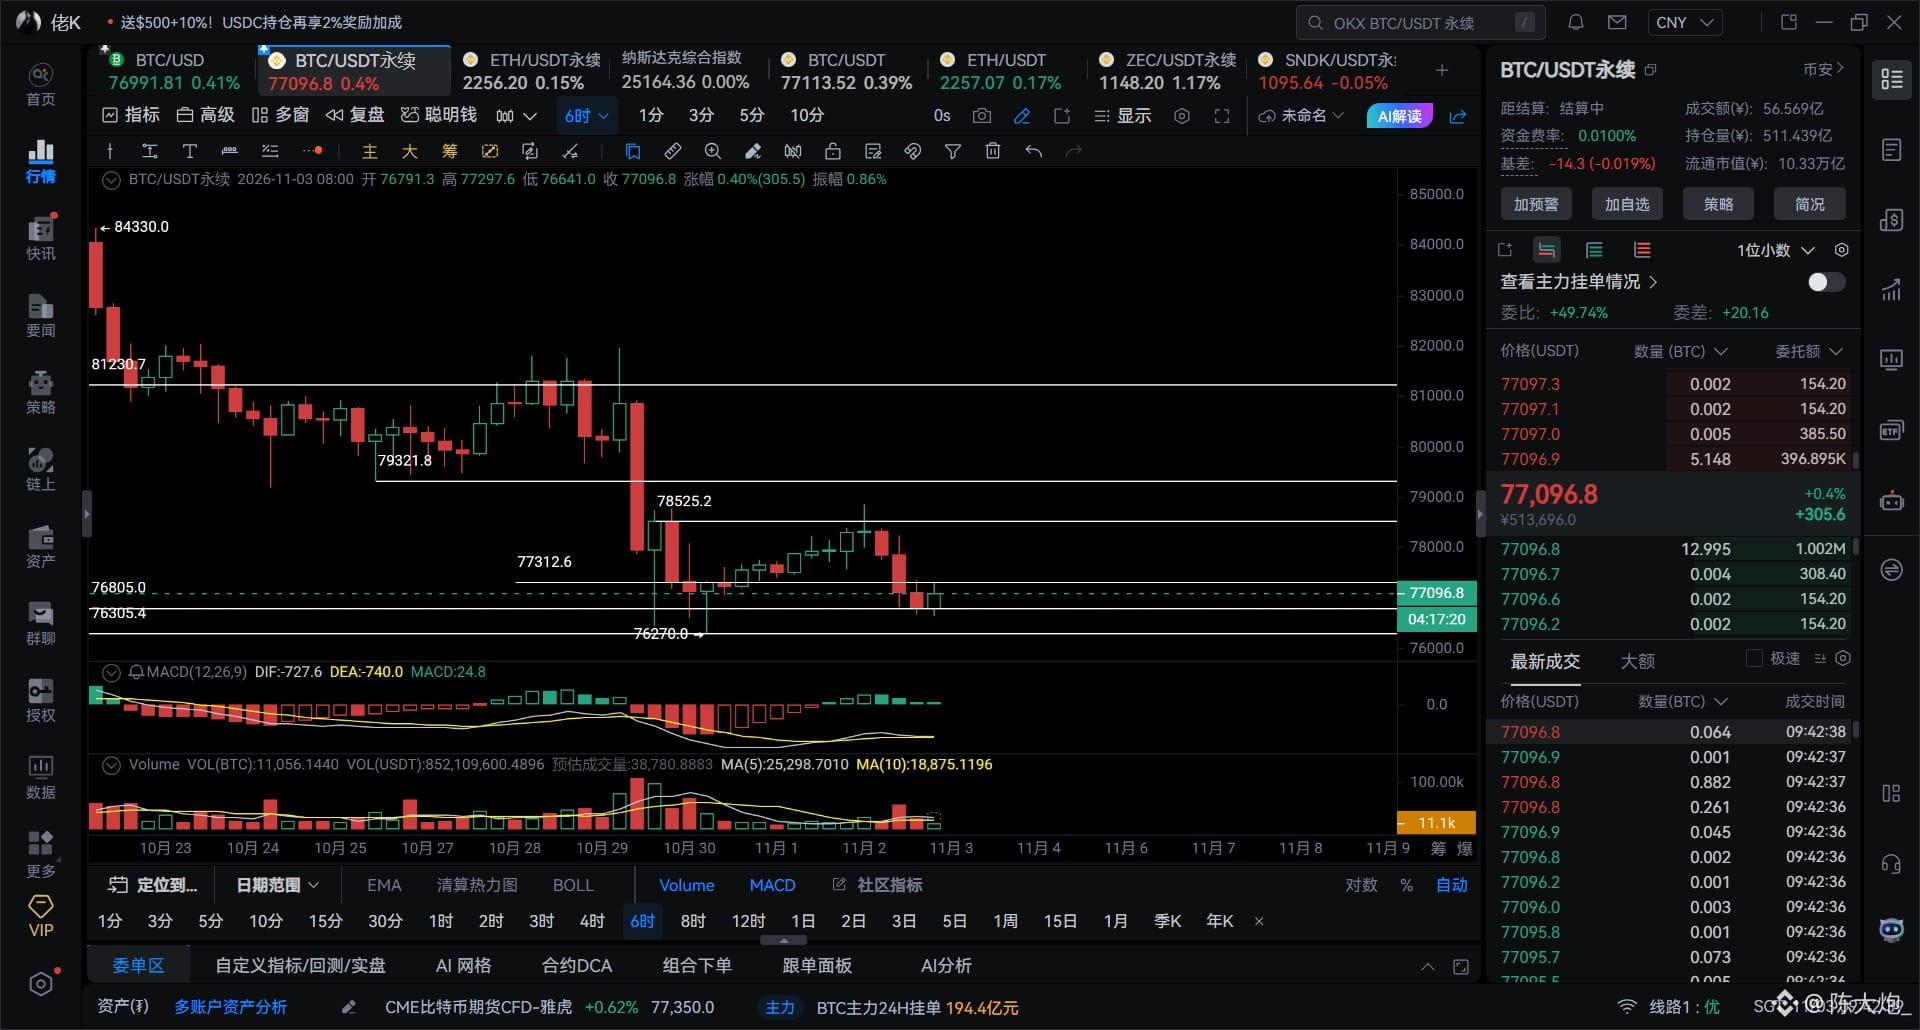
Bitcoin weekly hidden divergence: resistance above at 79,200. Yesterday, price touched 78,850 and began to pull back.
Price must not break below 76,270; otherwise, it will test 75,600, the zero line on the 2-day/3-day timeframes.
The 12-hour/8-hour charts are still below water and have not formed a golden cross. Hidden divergence on the 4-hour/6-hour charts; inverted on the 2-hour chart.
The 15-minute/30-minute charts are at the bottom. Don't take on too large a long position; scale in gradually.
Intraday resistance above: 77,500 78,200 79,200
Intraday support below: 76,800 76,300 75,600
Bitcoin weekly hidden divergence: resistance above at 79,200. Yesterday, price touched 78,850 and began to pull back.
Price must not break below 76,270; otherwise, it will test 75,600, the zero line on the 2-day/3-day timeframes.
The 12-hour/8-hour charts are still below water and have not formed a golden cross. Hidden divergence on the 4-hour/6-hour charts; inverted on the 2-hour chart.
The 15-minute/30-minute charts are at the bottom. Don't take on too large a long position; scale in gradually.
Intraday resistance above: 77,500 78,200 79,200
Intraday support below: 76,800 76,300 75,600