Today #BTC走势分析 🫶🫶
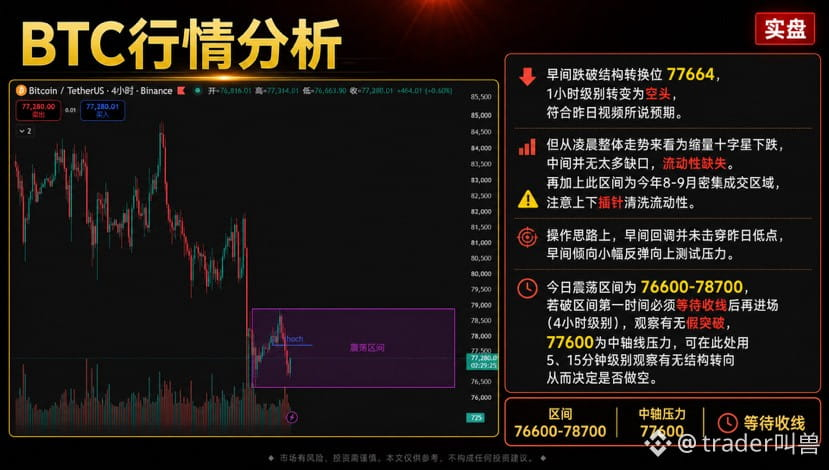
Price broke below the structure reversal level at 77664 this morning. The 1-hour timeframe turned bearish, in line with the expectations mentioned in yesterday’s video. However, looking at the overall price action since midnight, the decline came in the form of a low-volume doji, with few gaps along the way and a lack of liquidity. Also, this area saw heavy trading during August and September this year, so watch for wicks in either direction that sweep liquidity. In terms of trading strategy, the morning pullback did not break below yesterday’s low, so I’m leaning toward a slight rebound to test resistance. Today’s trading range is 76600–78700. If price breaks out of this range, you must wait for the 4-hour candle to close before entering. Watch for a false breakout. 77600 is the midpoint and a resistance level; you can use the 5- and 15-minute timeframes to look for a structural reversal and decide whether to go short.
Price broke below the structure reversal level at 77664 this morning. The 1-hour timeframe turned bearish, in line with the expectations mentioned in yesterday’s video. However, looking at the overall price action since midnight, the decline came in the form of a low-volume doji, with few gaps along the way and a lack of liquidity. Also, this area saw heavy trading during August and September this year, so watch for wicks in either direction that sweep liquidity. In terms of trading strategy, the morning pullback did not break below yesterday’s low, so I’m leaning toward a slight rebound to test resistance. Today’s trading range is 76600–78700. If price breaks out of this range, you must wait for the 4-hour candle to close before entering. Watch for a false breakout. 77600 is the midpoint and a resistance level; you can use the 5- and 15-minute timeframes to look for a structural reversal and decide whether to go short.