


When you see the price falling, it’s easy to write, “The outlook is bearish from here.” The hard part is deciding whether to acknowledge demand when a rebound does appear. Then it gets pushed back down—where is a reasonable place to assess an entry? If the market drops away immediately, did that assessment actually turn into a trading opportunity?
In this article, I want to follow a stretch of BTC price action to see how demand emerges, how it fails, and what new demand would need to do to change the outlook. Then I’ll apply that evidence to specific levels and turn it into a plan for taking a position—and canceling it if needed.#BTC
The example uses Binance BTCUSDT USDT-margined perpetual contract 4-hour candles, with all times shown in UTC+8, prices in USDT, and volume in BTC. This is a retrospective teaching example. The full period runs from 08:00 on September 28, 2024, to 08:00 on October 4 (excluding the end time). We examine it separately at three analysis cutoffs, with subsequent data shown separately; this is neither a blind test nor a real-time forecast.
Two bullish candles appear: acknowledge what they achieved
First, freeze time at October 1 at 16:00. A is the 4-hour candle that began at 08:00 on September 30, and B is the candle that began at 16:00 the same day. R is the bullish rebound candle that began at 12:00 on October 1 and closed at 16:00.
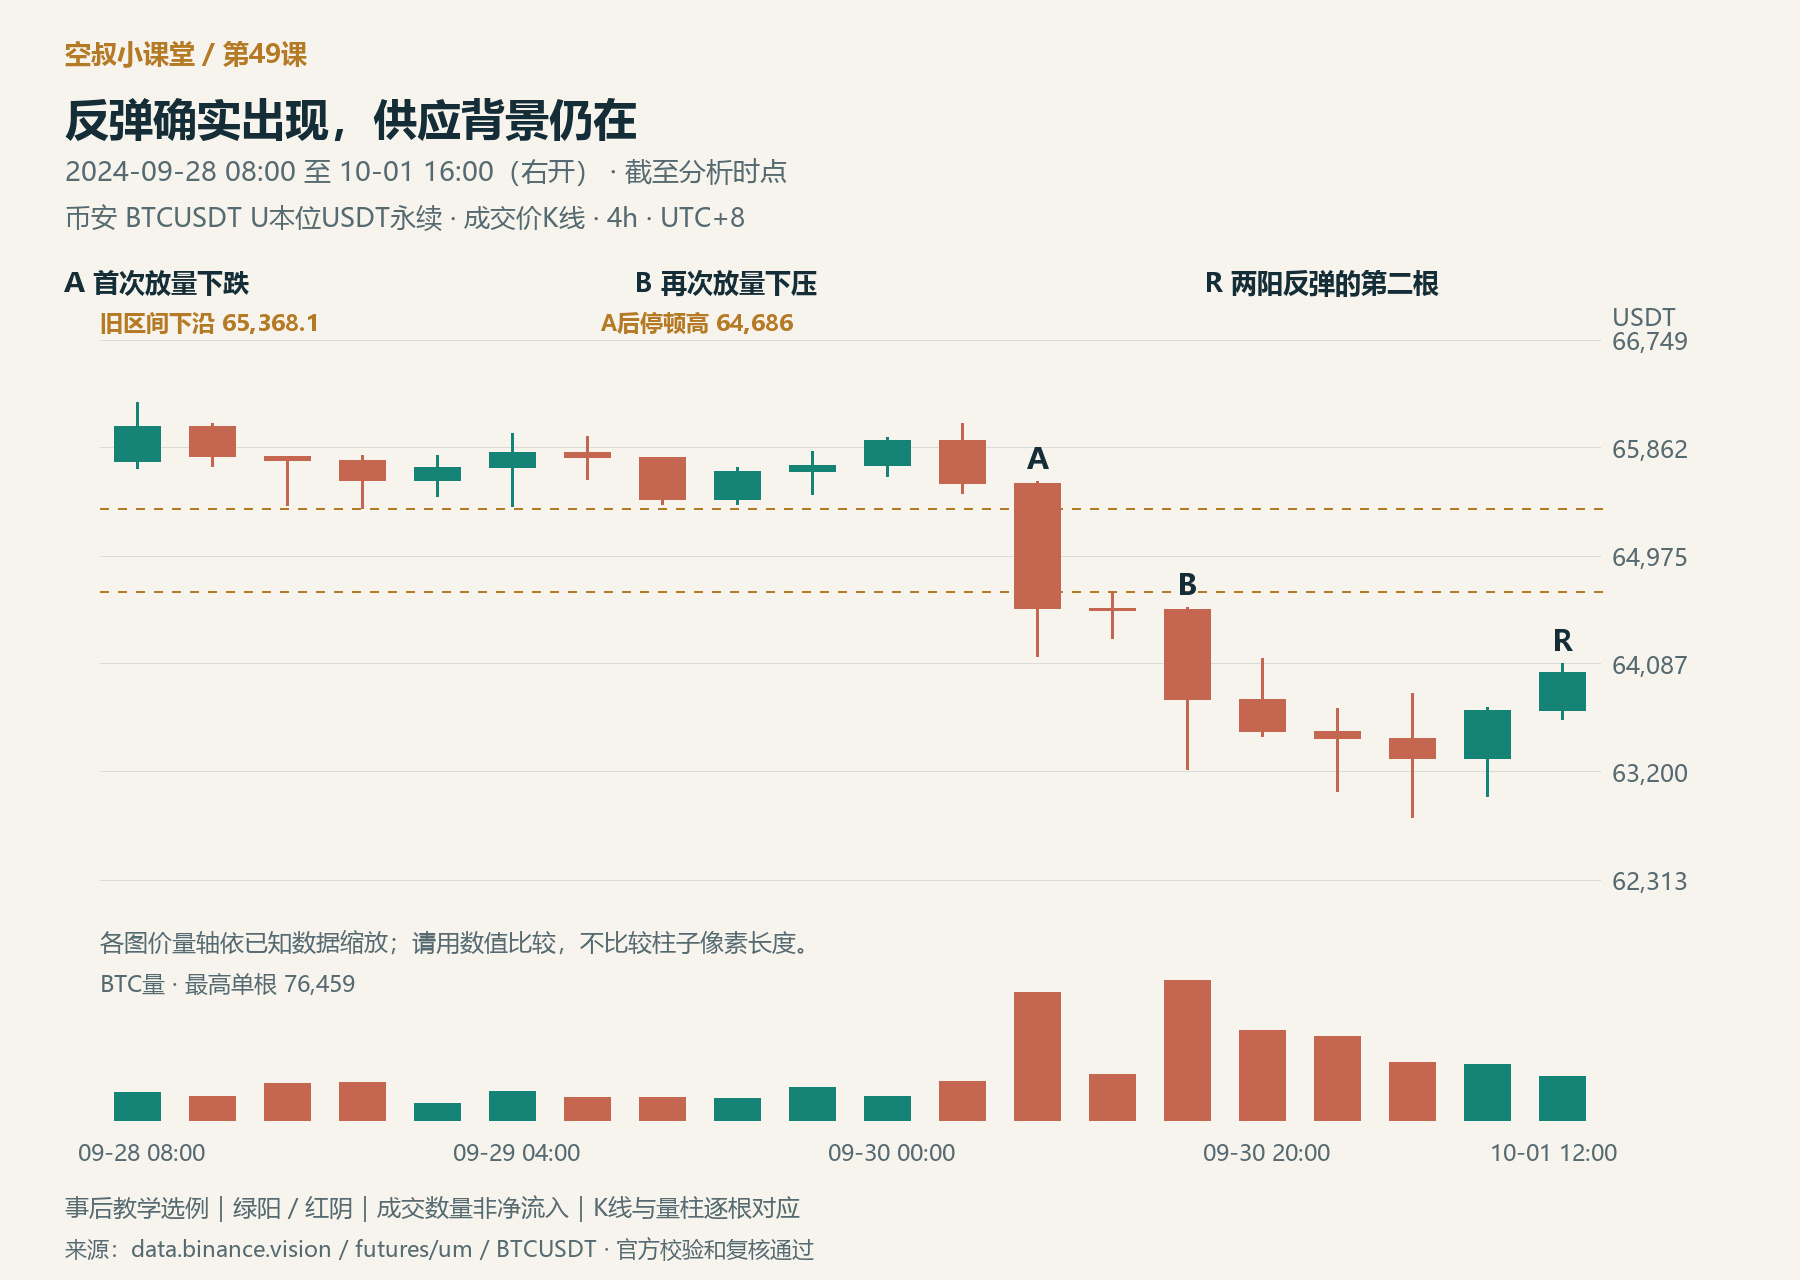
Figure 1 | As of October 1 at 16:00: A and B provide consecutive evidence of supply, and R is the second of two bullish rebound candles.
Before the decline, price had repeatedly stayed above 65,368.1. This level comes from the low of the candle at 20:00 on September 28 and serves as the lower reference boundary of the old trading range shown in the chart. A moved decisively away from that level on volume of about 69,900 BTC. After a brief pause, B pushed the low down to 63,222 on volume of about 76,500 BTC, higher than A's.
Here, supply means the effect selling pressure has on price. Selling pressure did not disappear after A; B continued to make downward progress. So the bearish assessment is supported by consecutive evidence, not just the color of a single candle.
Price then reached a low of 62,825, followed by two consecutive bullish candles. The first had a low of 63,000; the second had a low of 63,627.6. The lows rose, and R closed at 64,017. This was a genuine local demand response. If we call these two bullish candles “no buying at all” simply because price had fallen beforehand, we would miss the change taking place.
R's contribution was to push price away from the lows and lift the lows and closes of two consecutive candles. It has not yet returned to the high of 64,686 reached during the brief pause after A, much less recovered the old trading range. Volume declined with each of the two bullish candles. Following this stretch of sustained selling pressure, that is not enough to show that demand has gained a lasting advantage. The prevailing assessment remains that the 4-hour backdrop for this segment is weak, while a local rebound is developing.
We need to distinguish two kinds of progress here: bouncing from the lows shows that the decline met resistance; overcoming the supply area that caused the decline and holding those gains is what would change the bearish assessment for the relevant range. R achieved the former; the latter is still being tested.
The practical implication of this assessment is specific: first watch how far the rebound can advance; once it reaches a known supply area, test whether the rise stalls. R is still pushing higher, so we cannot prematurely write it off as “a failed rebound,” much less declare R a short entry just to express a bearish view. If demand breaks through and holds above the relevant supply area, the original reason for waiting for a weak rebound there must be canceled.
A 60-minute bond-market example in the textbook shows exactly why this kind of local improvement should be acknowledged. The author labels the area above the sharp rally X and the subsequent low Y: before X, a buying climax occurs, when urgent buying meets supply. The pullback from X to Y lacks sustained selling pressure, so the author still expects a rise. But the push up after Y is weak, and then the two declines labeled 1 and 2 grow successively larger. Volume increases on 2, and supply begins to follow through persistently.
A Spring pattern appears at 2: price briefly dips below support and then recovers, like a spring bouncing back. Given the supply backdrop, the pattern alone cannot serve as a buy point. At the same time, the first long bullish candle after 2 has a higher low, and the author explicitly acknowledges that demand temporarily had the upper hand. To maintain the earlier bullish interpretation, demand still needs to push above 2 and overcome that supply. This is similar to R in one important respect: acknowledge the counterattack without turning it into proof that the trend has already changed. The textbook's letters and numbers do not correspond candle by candle to BTC; the 60-minute and 4-hour charts are compared only in terms of supply-and-demand dynamics.
What truly changes the assessment is what the next wave of selling pressure achieves
Now move forward to October 2 at 00:00. After R, there is first a pullback, followed by S in the chart: the 4-hour candle that began at 20:00 on October 1.
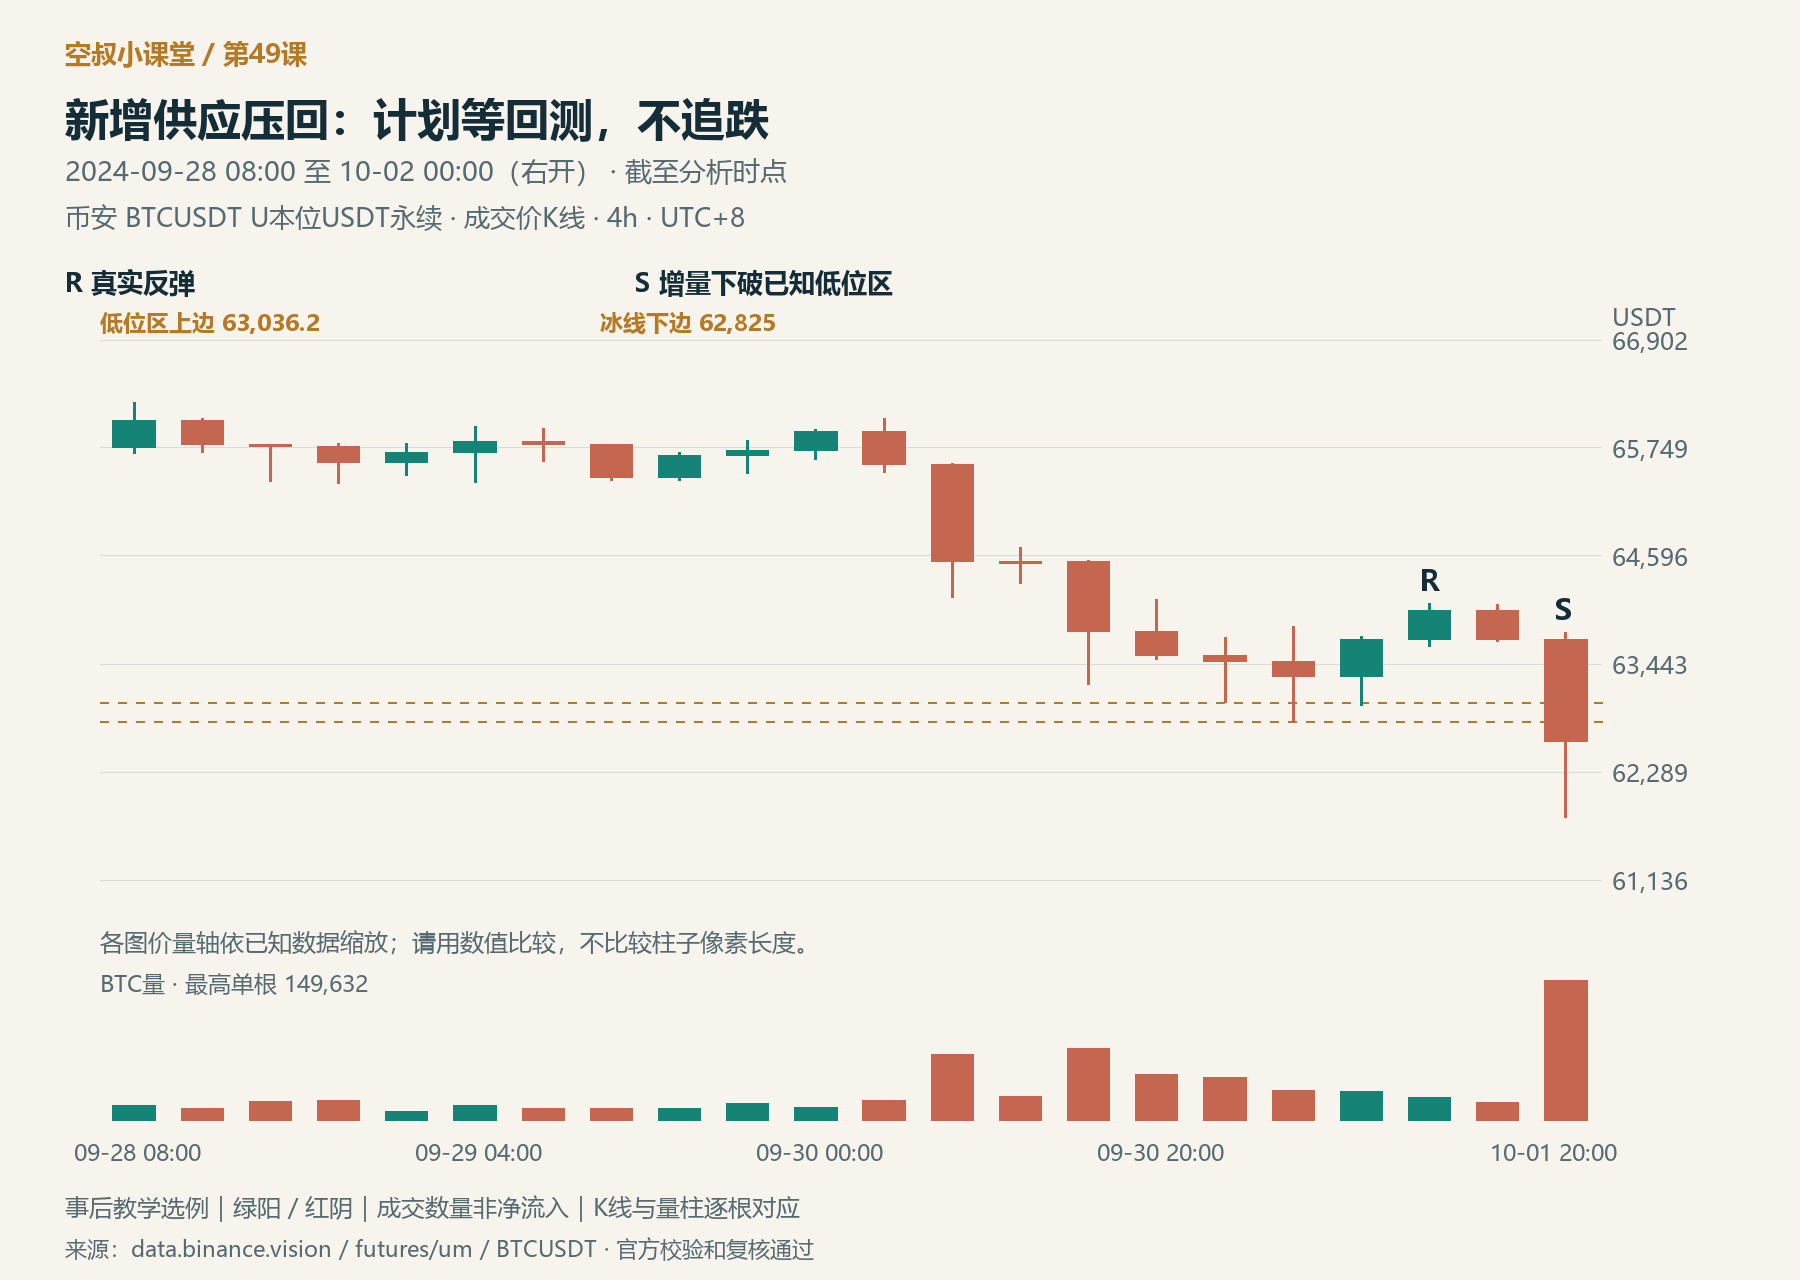
Figure 2 | As of October 2 at 00:00: S breaks below the 62,825–63,036.2 low reference area on increased volume; R's rebound could not hold back this wave of supply.
S traded about 149,600 BTC in volume, clearly more than A, B, and R. Its low was 61,801.6, and it closed at 62,613.8. Both previously identified lows—63,036.2 and 62,825—were broken, and the close remained below them.
The change brought by S is more than just another bearish candle. The gains R made in pushing price up from the lows were erased; S also broke below the pre-rebound low and closed beneath it. Higher volume accompanied fresh downward progress, showing that the earlier demand did not hold back supply. We can now state clearly that, within this segment's 4-hour structure, supply has regained the upper hand and the bearish case has strengthened. This does not mean using six days of price action to make a claim about BTC's long-term trend as a whole.
In the bond example, genuine demand also appeared after 2, but the candle labeled 3 later fell on increased volume and closed near its low, with little sustained support for the rebound. When 4 tested the lows a second time, volume decreased only slightly. The subsequent rebound remained weak, and demand did not overcome supply; 5 then broke below support. The key is what counterevidence appeared after demand—not to dismiss the earlier long bullish candle as meaningless just because price eventually fell.
We mark 62,825–63,036.2 as an area to be tested because it consists of lows that were already in place before the breakdown. Once a level that previously limited the decline is broken, a return from below tests whether it will now begin to limit a rise. Wyckoff likens this broken support to an “ice line”; “breaking the ice” means breaking below it, while “testing the ice” means rebounding from below to retest it. Here, 62,825 is used as the lower boundary of an area; a precise horizontal line is not treated as inherently valid resistance.
A plan that can be canceled should at least specify this much
When S closed, we had a bearish basis and an area to wait for a rebound to test: 62,825–63,036.2. From here, we need to distinguish three stages in sequence.
First, price reaches the area. A rebound from below into this area only means the retest has begun. Touching or crossing the lower boundary at 62,825 does not automatically prove that demand has recovered, nor is it an entry signal. At this point, we have not entered, so there is nothing to exit because price has “broken above the ice line.”
Next, see whether the retest meets resistance. The conditional plan used here is to wait for the upward push to stop, then for price to fall back below 62,825 and selling pressure to reappear before assessing a short entry. The basis is that “price returned to the vicinity of former support, failed to hold there, and retreated below it again.” Lower volume can help compare the rebound's strength with S, but it cannot replace this price action. If price continues to lift its closes and moves above the area and holds there, anyone who has not entered should cancel this weak-rebound plan.
After entry, test whether the conclusion that the rebound met resistance still holds. Suppose the sequence described above occurs and, based on it, a short position is opened below the area. If price then breaks back above 62,825, it reaches this plan's exit condition. Before entry, we were waiting for the retest; now we are checking whether the established conclusion that the “rebound met resistance” has been invalidated. Price can revisit the same level twice, but the sequence and the judgment being tested are different. Here, 62,825 is the exit reference boundary for this local plan; crossing it does not mean the broader trend has turned bullish.
In the textbook's bond example, the start of the low-volume rebound labeled 6 also did not call for an immediate short: the original plan was to wait for price to test the ice and stop rising before entering. Existing shorts were to exit if a bullish candle broke back above the ice line; a high-volume decline was a reason to consider holding. The textbook organizes the plan around a single ice line, while the BTC example uses a low-price area and its lower boundary. Do not confuse “entering the area” with “a later failure after entry.”
Additional execution priority for this series: if the preset price stop is triggered first, execute it first—do not wait for a rebound, volume, or the close. The explanation above describes the conditions and their order; it does not invent orders, positions, or an exact stop-fill price that actually occurred.
Now move forward to the third cutoff: October 2 at 16:00.
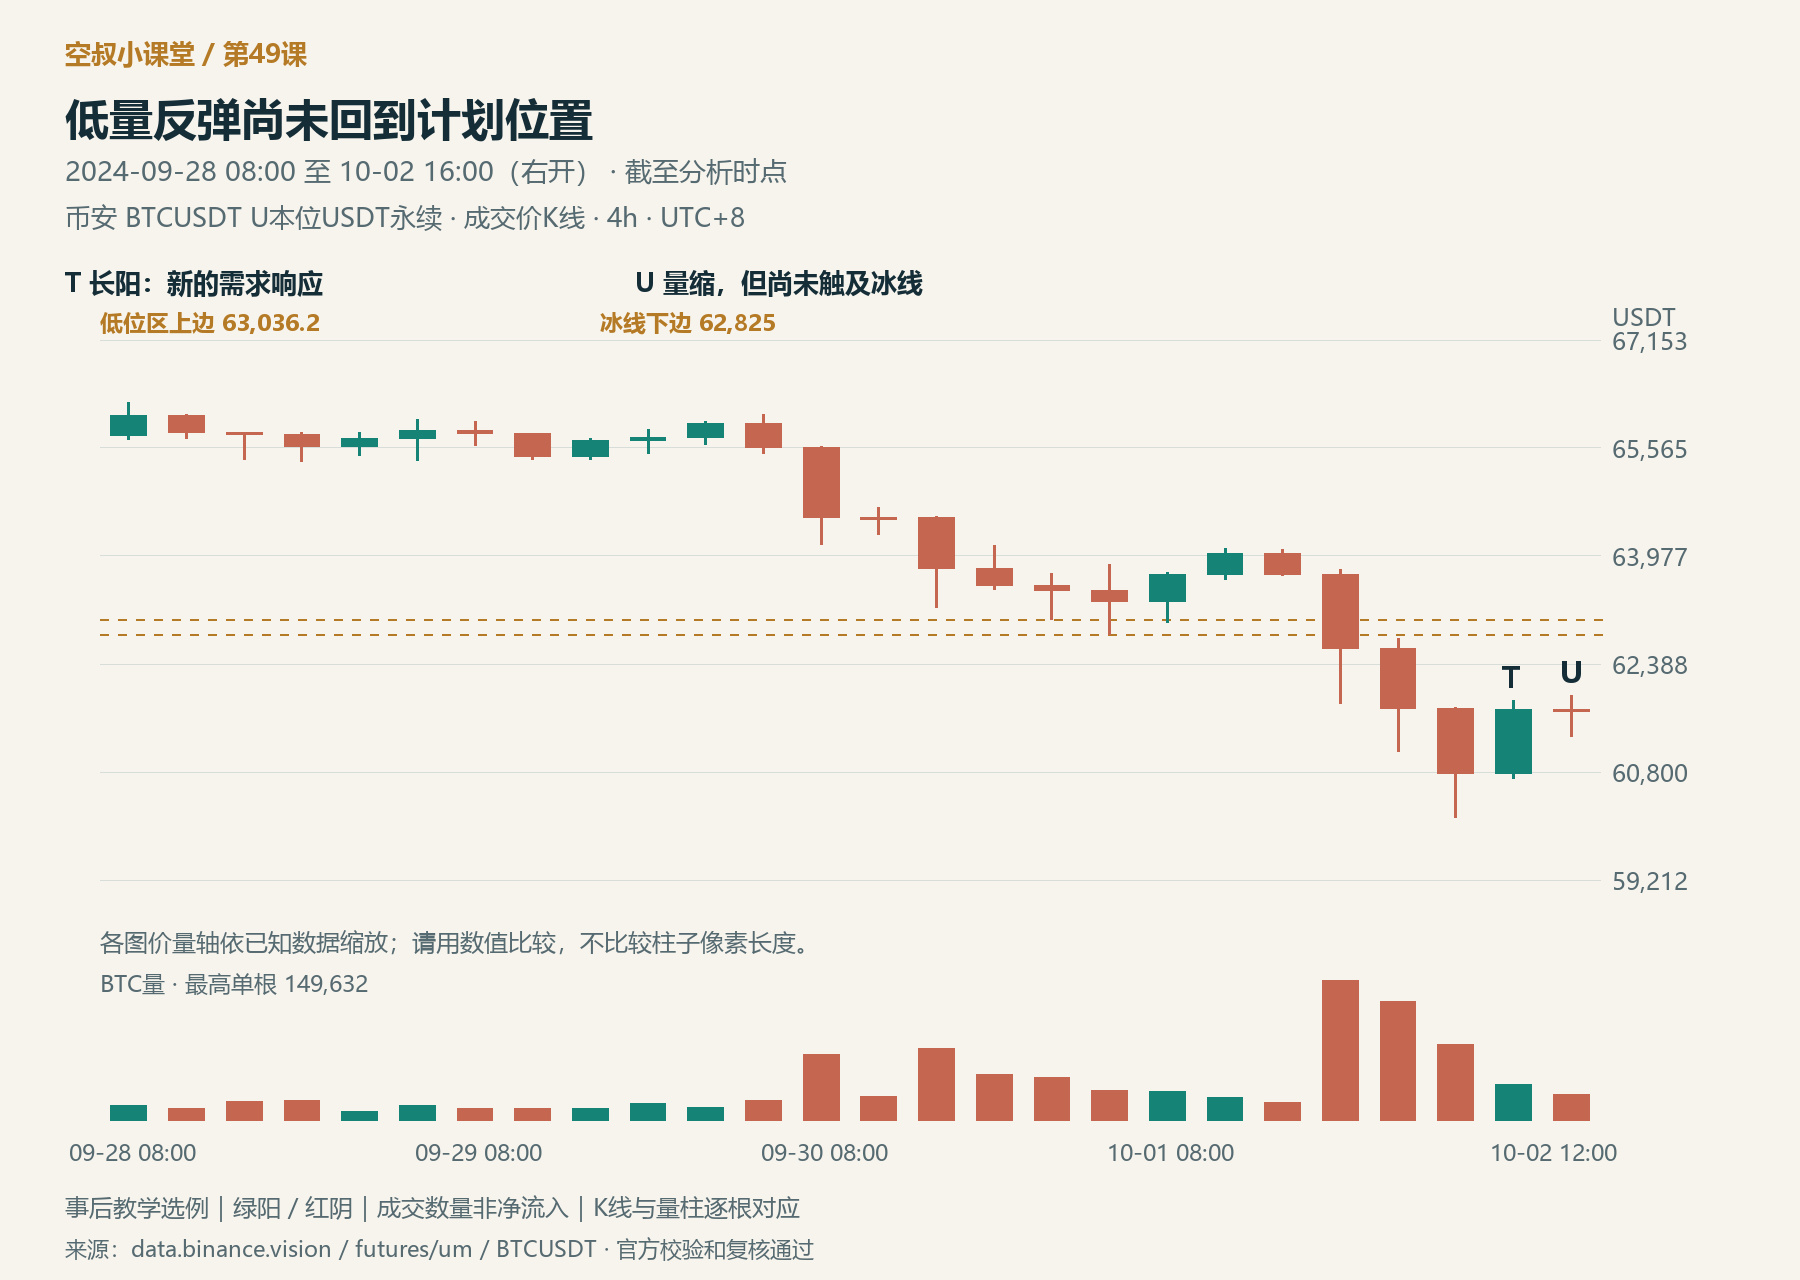
Figure 3 | As of October 2 at 16:00: T is a new strong demand response, and U is on lower volume; neither has yet returned to the lower boundary of the ice line at 62,825.
After S, the price probed lower again, reaching 60,128.2. T in the chart is the strong bullish candle that began at 08:00 on October 2: its low was 60,703.3, above the previous candle's low, and it closed higher at 61,718. This is also genuine demand and should not be ignored just because the preceding context was bearish. U is the candle immediately after it. Its high was 61,926.7, and volume fell from about 37,500 BTC on T to about 27,100 BTC. The close did not move higher.
T did change one thing: it interrupted the sequence of consecutive downward pressure after S, and the price began responding upward from a new low. Therefore, we should not assume that every subsequent candle will keep falling. Next, we should test whether this upward push can continue and reclaim the area that was just lost.
But T has not yet repaired the breakdown caused by S, and U did not push the close any higher. Both candles' highs remain below 62,825. So they provide “new demand that deserves attention,” not evidence that “demand has already overcome the breakdown area.” The direction of this segment remains weak; as far as the plan is concerned, price has not even reached the retest area. This does not mean that every sign of demand must immediately reverse the trend. It means that any change in our assessment should be proportionate to the progress actually made.
R and T should not be compared solely by the size of their bullish candles. R appeared above the former low area, but S later broke below that area, disproving the idea that R had stopped the decline. T appeared at a lower level, after the breakdown; to change the current bearish plan, price needs to reclaim the area it just lost. For now, T has only begun to fight back. U's lower volume and limited progress are worth watching, but they do not justify moving the ice line down to U's vicinity and prematurely treating the retest as complete.
The textbook describes the rally after 6 as a “no-demand rally.” Here, that should be understood as a lack of demand strong enough to change the supply backdrop, not as there being no buyers at all. Every trade has both a buyer and a seller, and total volume is not net inflow.

Figure 4 | First price enters the area for a test; only after it meets resistance and retreats below do we assess participation. A subsequent break above the lower boundary after entering is a failure at a different stage. Teaching illustration, not actual market data.
The price did fall later, but that still does not justify inventing a trade after the fact
Finally, let’s look separately at what happened after October 2 at 16:00 and before October 4 at 08:00.
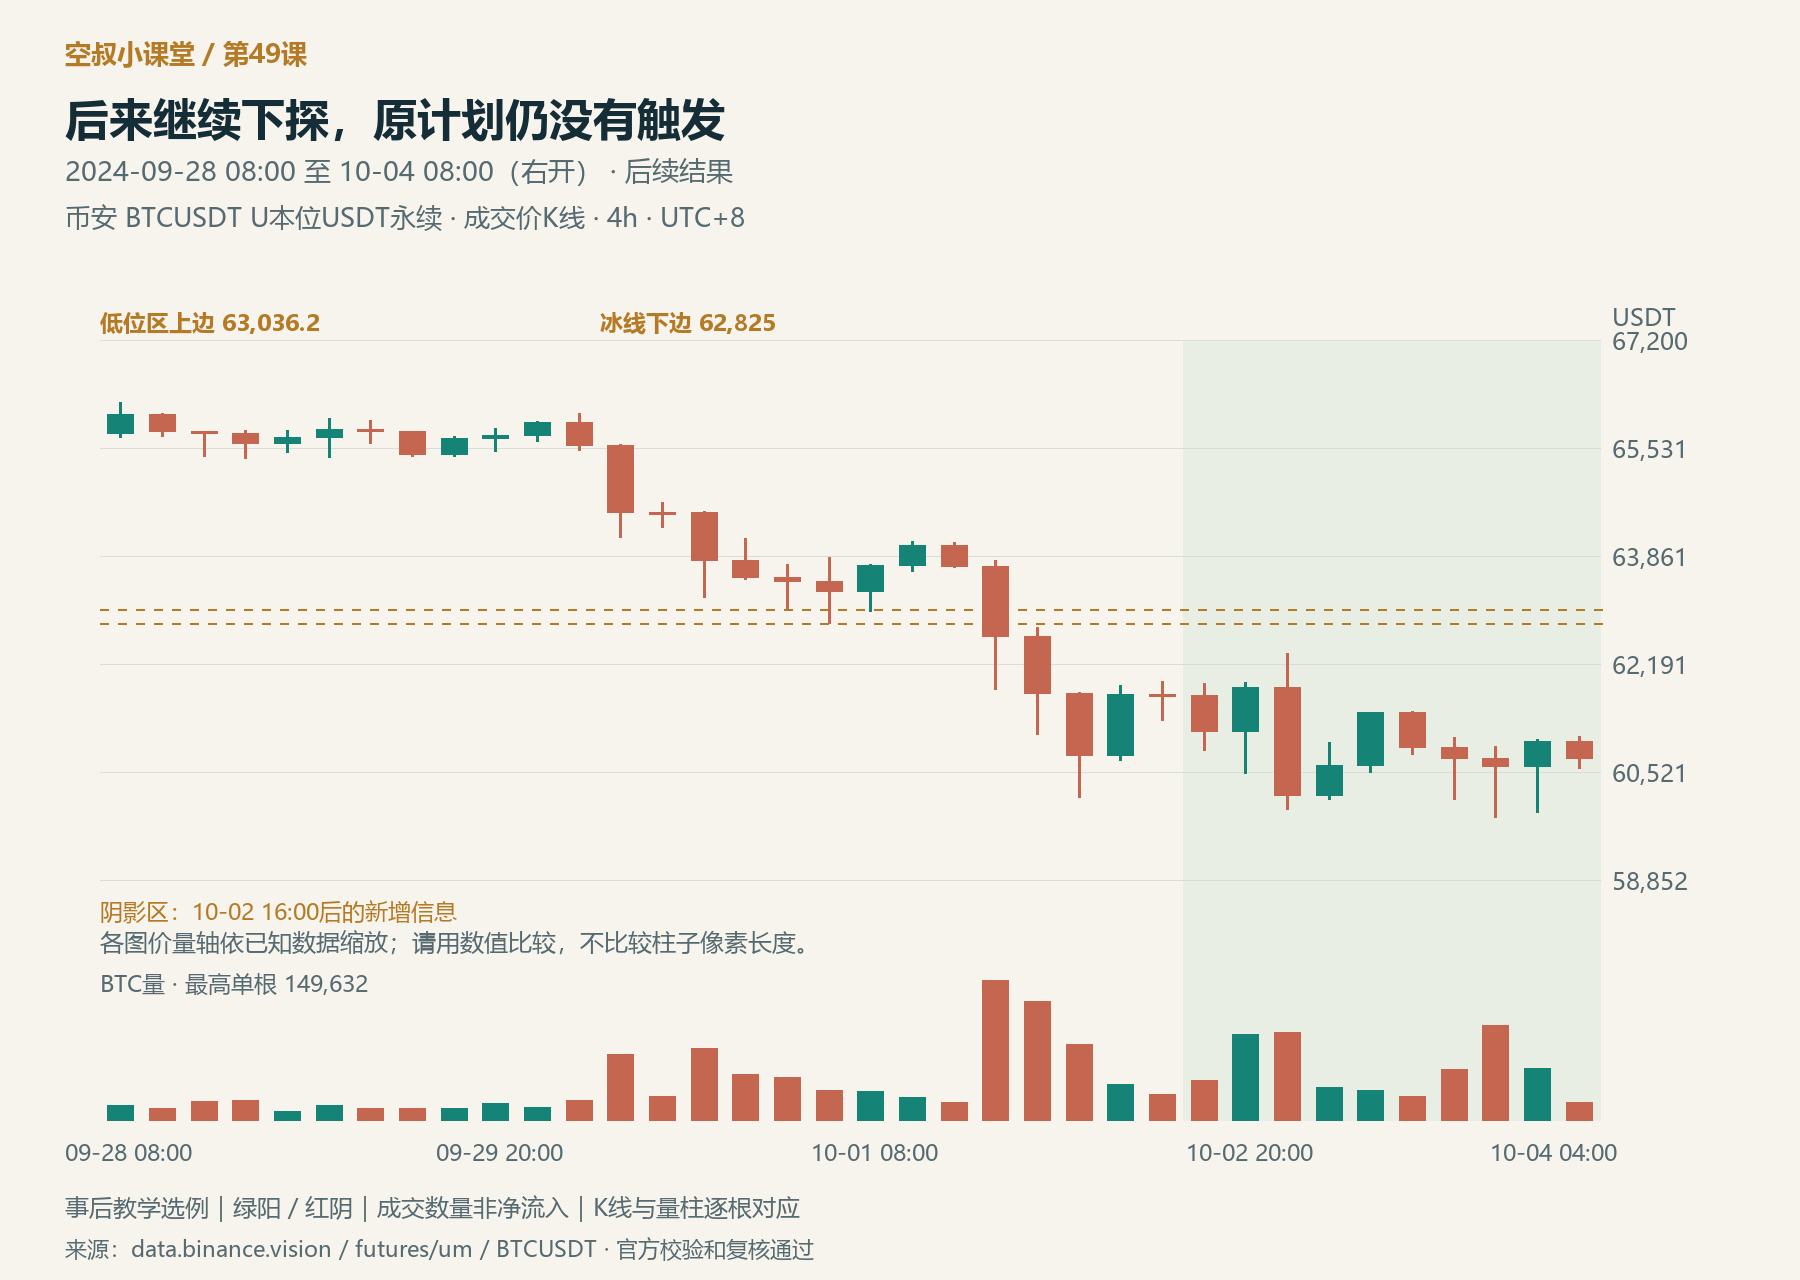
Figure 5 | Subsequent outcome: the shaded area shows new information after the third cutoff. During this period, price probed down to 59,815 and also rebounded, but it never reached the planned retest area.
In this additional price action, the rebound peaked at 62,355, still below 62,825; afterward, the low reached 59,815. There was an upward response during this period, so it would be inaccurate to depict the move as a straight-line decline. The outcome supports the assessment that this segment was weak, but it did not provide the retest area required by the original plan, so the plan offered no entry opportunity. The observation window ends here; that does not mean price will never return afterward.
The corresponding textbook outcome also explicitly describes the same kind of result: the rally after 6 did not offer an entry under the original plan, and price then continued to decline. The author explains the establishment and removal of support as the actions of CM; in the book, CM represents the force of large professional interests. This is the author's interpretation of intent. What can be directly confirmed from the chart is that support was broken, the rebound did not recover it, and price later continued to fall. This does not verify institutional positions or order cancellations.
The review therefore has two separate answers: subsequent action supported the assessment that this segment was weak, and the original participation condition did not occur. A correct directional assessment does not mean a trade took place.
Learning summary
What I want to remember this time is that genuine demand appearing and demand being strong enough to change the assessment are two different things. R pushed price away from the lows; S invalidated its effect with stronger supply and new downward progress. T then interrupted the downward pressure, but has not yet repaired the breakdown. The assessment should adjust to these specific developments, rather than jumping between the labels “bullish” and “bearish.”
To turn an assessment into a plan, also spell out the sequence: returning to the area is only the start of the test; meeting resistance and retreating provides a basis for assessing participation; only a subsequent breakout after entering invalidates that basis. Those who have not entered should cancel the plan; those already in should exit, with the price stop taking priority.
Practice exercise
Looking only at Figure 3, why is T's demand response still not enough to cancel the bearish plan? Suppose price subsequently returns to the 62,825–63,036.2 area. Should we exit as soon as it crosses 62,825? Explain the meaning of each of these three stages: the retest is not yet complete; participation occurs only after price meets resistance and retreats; and a subsequent upward breakout after participation. Then use Figure 5 to determine whether this example actually produced an entry opportunity.
Feel free to share your reasoning in the comments; don't just answer “up” or “down.” A suggested explanation will be added to the comments on this post later.