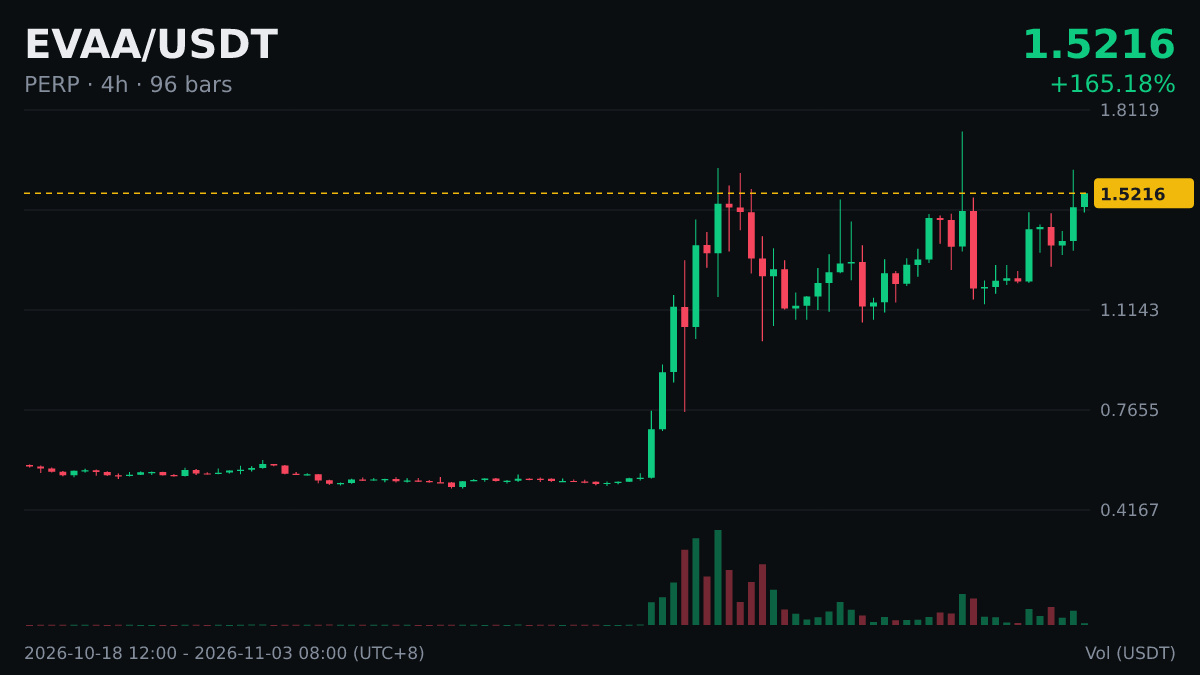
🐳 $EVAA 4-hour golden cross. Looking at it from the perspective of chip distribution:
The bearish momentum histogram lasted for 9 four-hour candlesticks, indicating that sellers had been in control. Now selling pressure has finally eased. Also, since it is above the zero line, if enough chips change hands during the pullback, buyers will find it easier to take control again.
Which indicators do you usually follow?
The bearish momentum histogram lasted for 9 four-hour candlesticks, indicating that sellers had been in control. Now selling pressure has finally eased. Also, since it is above the zero line, if enough chips change hands during the pullback, buyers will find it easier to take control again.
Which indicators do you usually follow?