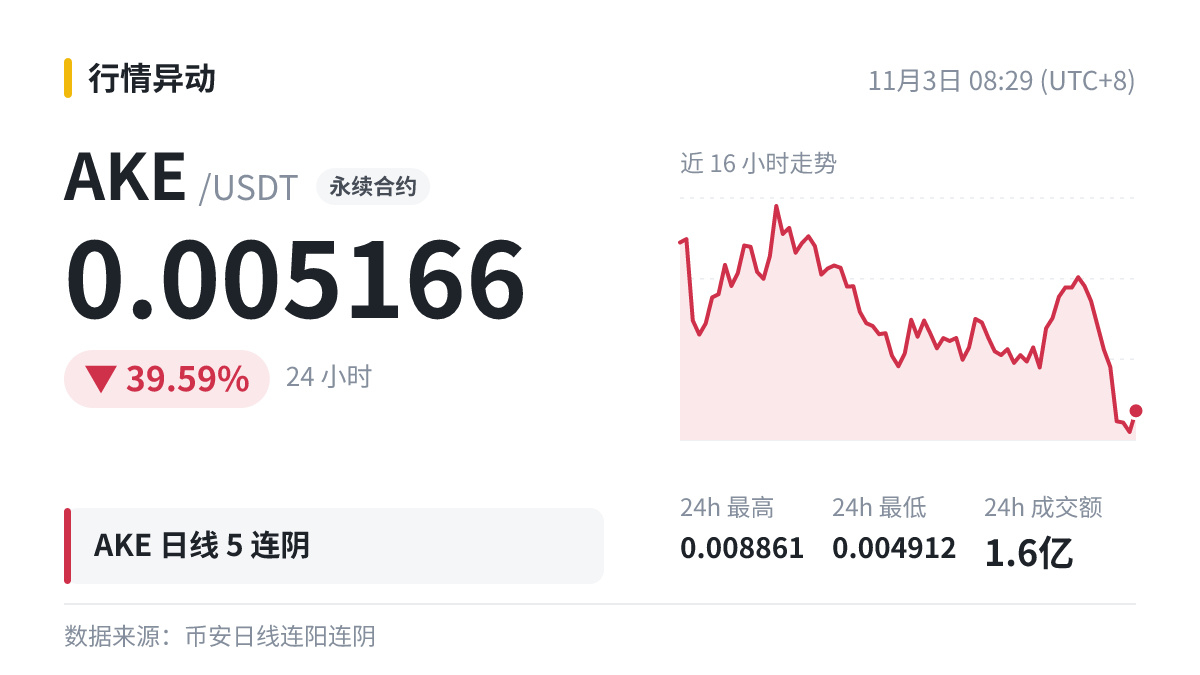
$AKE The daily chart has had 5 consecutive bearish candles, with a cumulative decline of -77.67% over that period. It’s up +2.42% so far today.
Let’s use this example to break down consecutive bullish and bearish candles.
Consecutive bearish candles on the daily chart are different from a series of candles on the 4-hour chart: each daily candle represents a full day of buying and selling, so several consecutive candles of the same color are less common on the daily chart.
There’s no set duration for a bullish or bearish streak. Some last a long time, while others reverse after just a few days. The number of days alone can’t predict what happens next.
Understanding indicators isn’t difficult. The hard part is sticking to the rules when the market is at its most exciting.
Stay rational, and don’t get carried away.
Let’s use this example to break down consecutive bullish and bearish candles.
Consecutive bearish candles on the daily chart are different from a series of candles on the 4-hour chart: each daily candle represents a full day of buying and selling, so several consecutive candles of the same color are less common on the daily chart.
There’s no set duration for a bullish or bearish streak. Some last a long time, while others reverse after just a few days. The number of days alone can’t predict what happens next.
Understanding indicators isn’t difficult. The hard part is sticking to the rules when the market is at its most exciting.
Stay rational, and don’t get carried away.