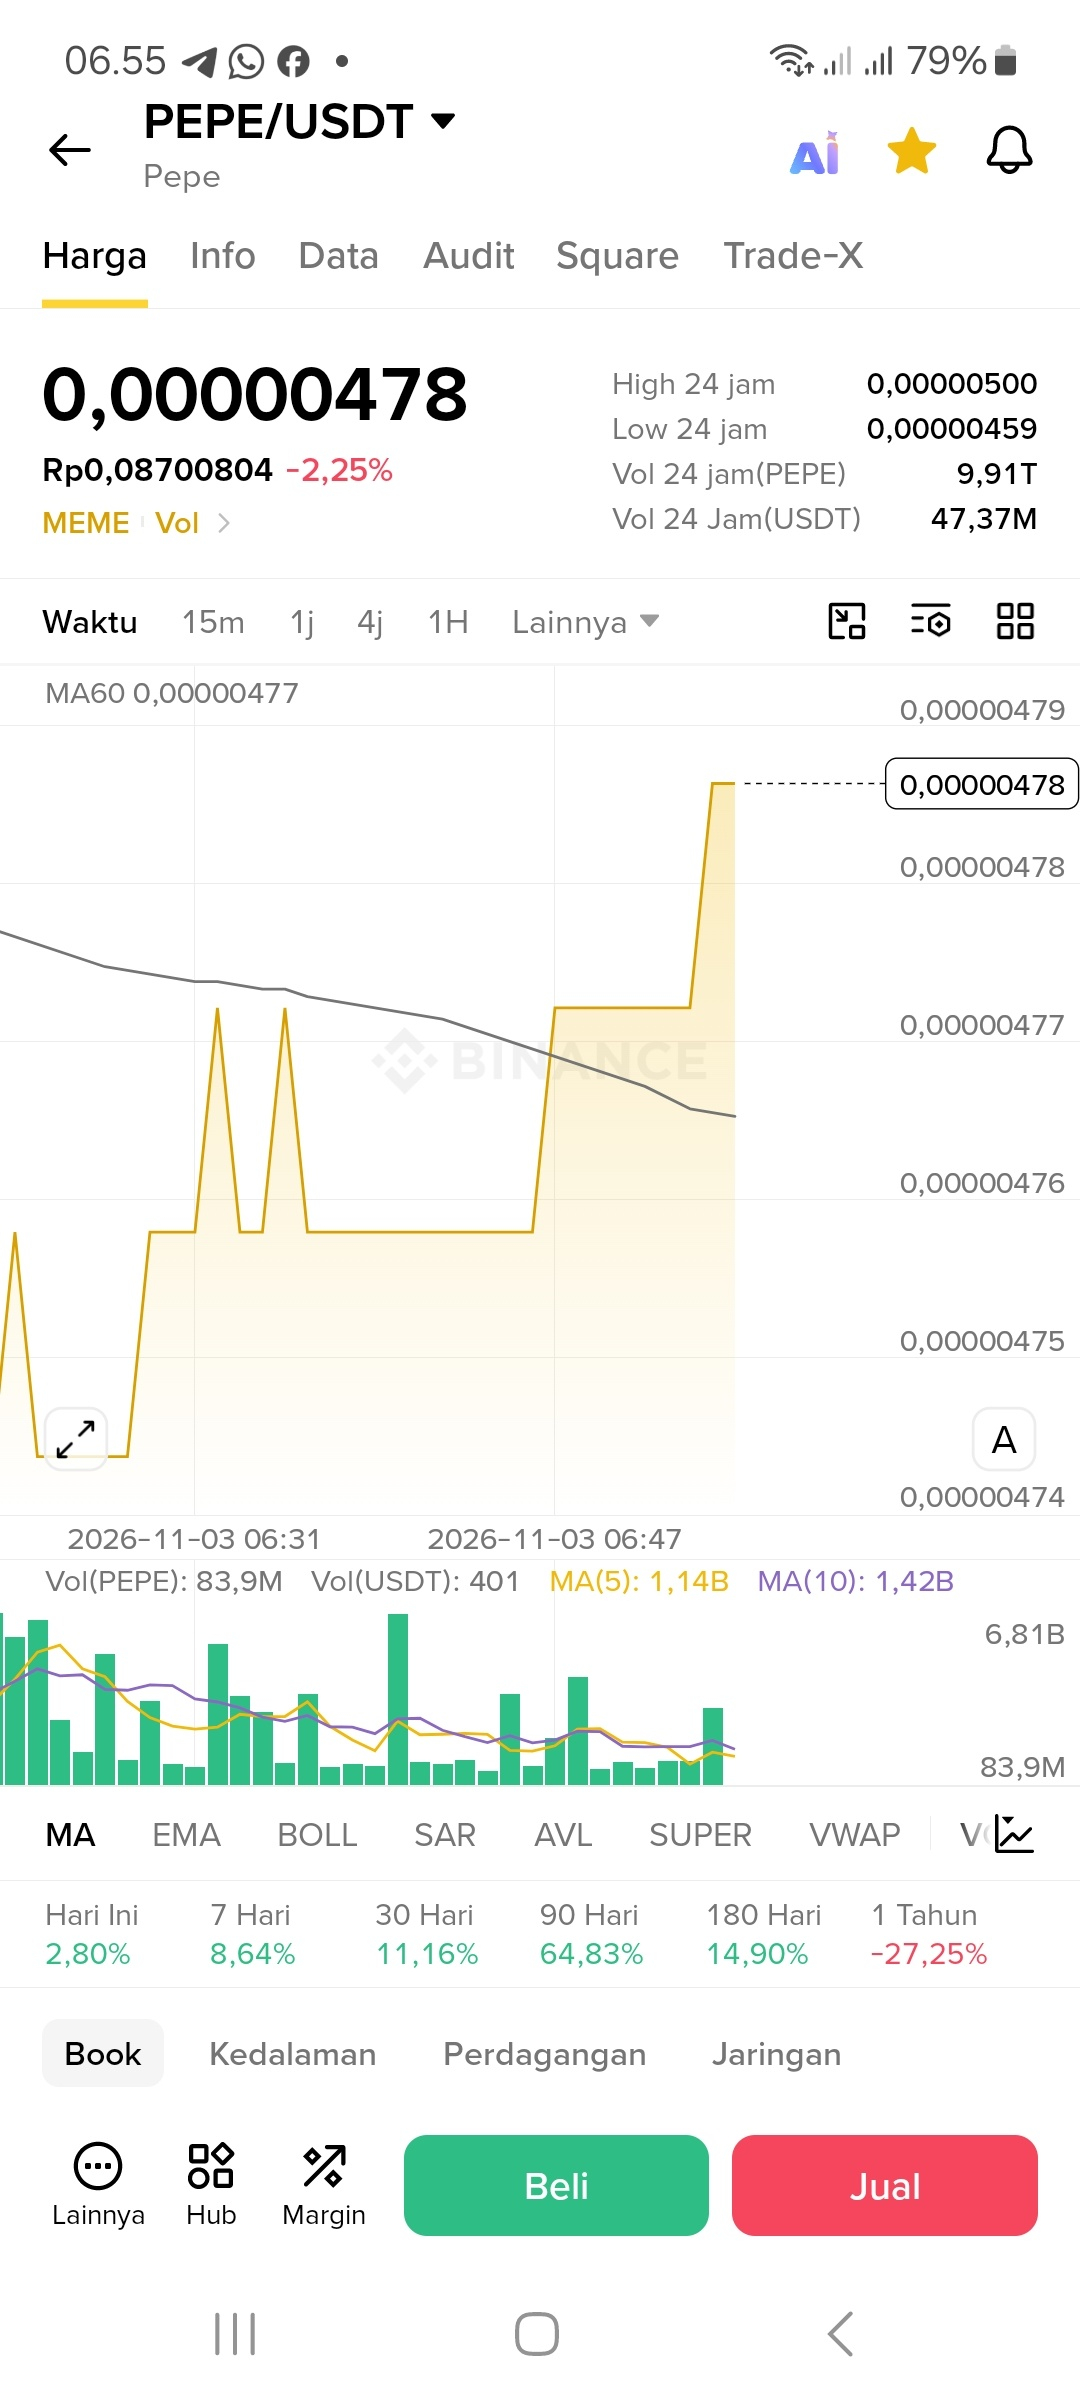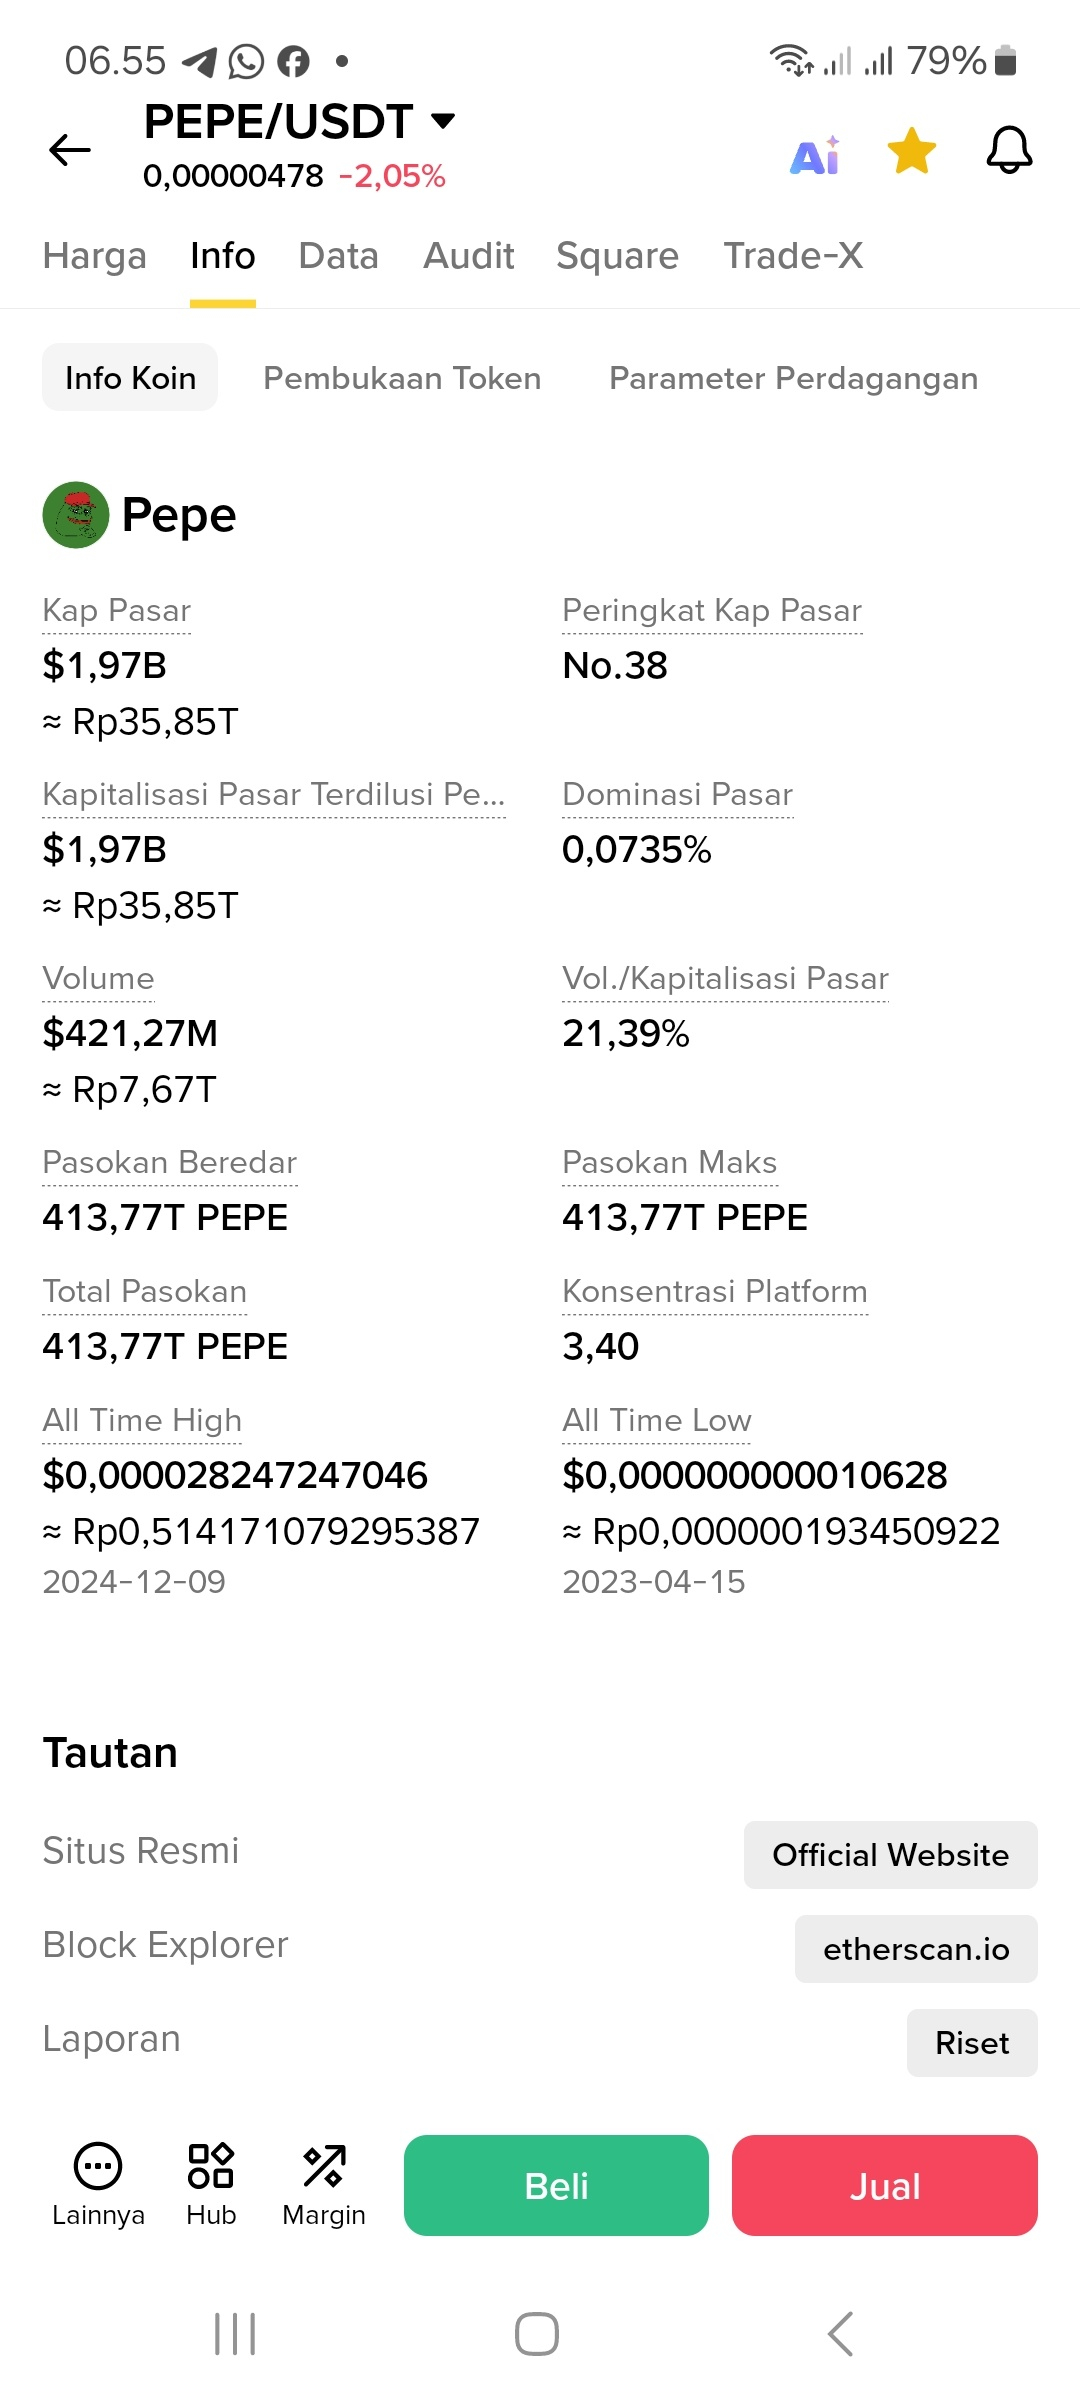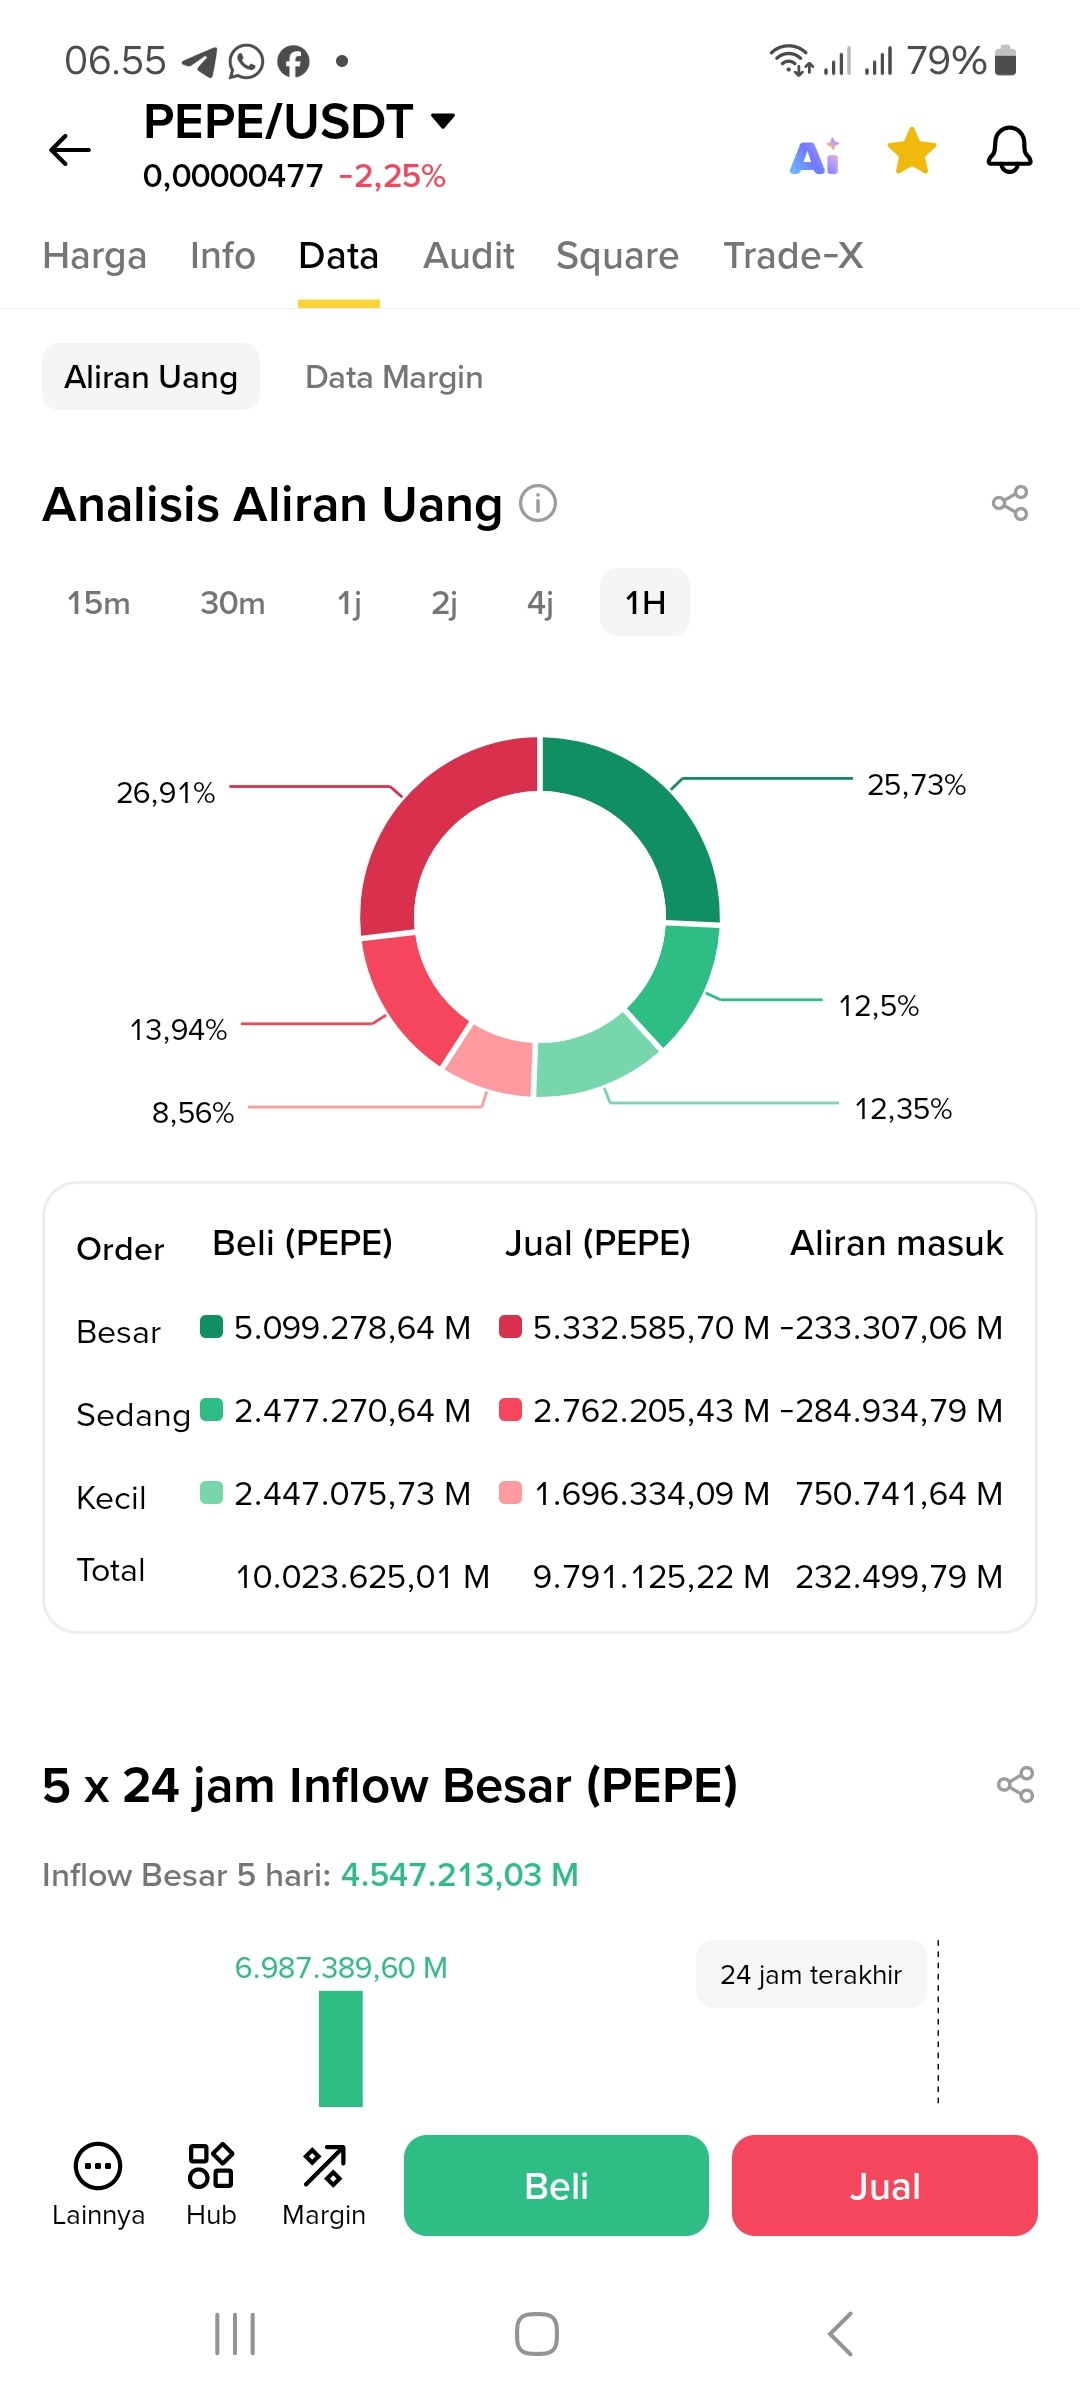
In short: PEPE really has a hard time “staying still.” Over the last 14 days, the average daily range (high–low) reached 11.52%, with a peak of 26.15% on Oct 30. The average daily price movement (open→close) was around 4.8%, even though the net direction wasn’t that significant — this is what feels “volatile.”
Measured figures (Binance daily data, as of Nov 3, 2026 WIB; latest candle: Nov 2)
Change: 1D +1.92%, 7D +9.15%, 30D +11.45%, 90D +63.92%, 1Y −27.29%. Last closing price: $0.00000477.
14-day range: low $0.000004 → high $0.00000568 (Oct 29), or +10 (Oct 20)38.54%; then it fell again to a low of $0.00000459 on Nov 2, −19.19% from that peak.
Daily volume surged to around $227.8 million (Oct 29) and $188.9 million (Oct 30), compared with an average of around $51.9 million on other days in the same period—about 4.39× and 3.64×.
Why was the move so extreme?
Thin liquidity. PEPE's daily trading value is in the tens of millions of dollars, very small compared with BTC/ETH. Orders of the same size move the price much more, so large flows show up immediately on the chart.
Driven by large order flows, not fundamental news. On Oct 29–30, volume surged 3–4× alongside a sharp decline. The saved research report for PEPam;E (snapshot Nov 2, 23:57 UTC) mentions large liquidations from wallets also linked to a security incident at an exchange, compounded by large order outflows. That's the report's explanation, not live data.
Reflexive behavior after a drop. The same report notes that RSI_6 was briefly extremely oversold, followed by some buying and inflows, so the price partially rebounded—the rebound and subsequent fall are what added to the amplitude.
No cash flows or utility. PEPurni's valuation depends purely on momentum and the meme community narrative, so its price is highly sensitive to broad market sentiment and leverage (funding/perpetuals), not revenue or adoption.
Concentrated holder base. Large holders still holding positions (the report cites around 372.99 billion tokens, ≈$1.75 million) mean the potential for gradual selling remains as a recurring source of pressure.
Worth noting: volatility does not indicate direction. Despite being up 63.92% in 90 days, the 1-year position is still −27.29%—a major rally within a yearly trend that has yet to recover. The 24-hour figure in the saved research report (−2.2%) comes from an earlier snapshot and differs from my 1D calculation (+1.92%), so I'm using the measured K-line data above.
This content is for informational purposes only, not investment advice; crypto assets are highly volatile, and you should do your own research and consider your risk tolerance.$PEPE $SOL $DOGE