
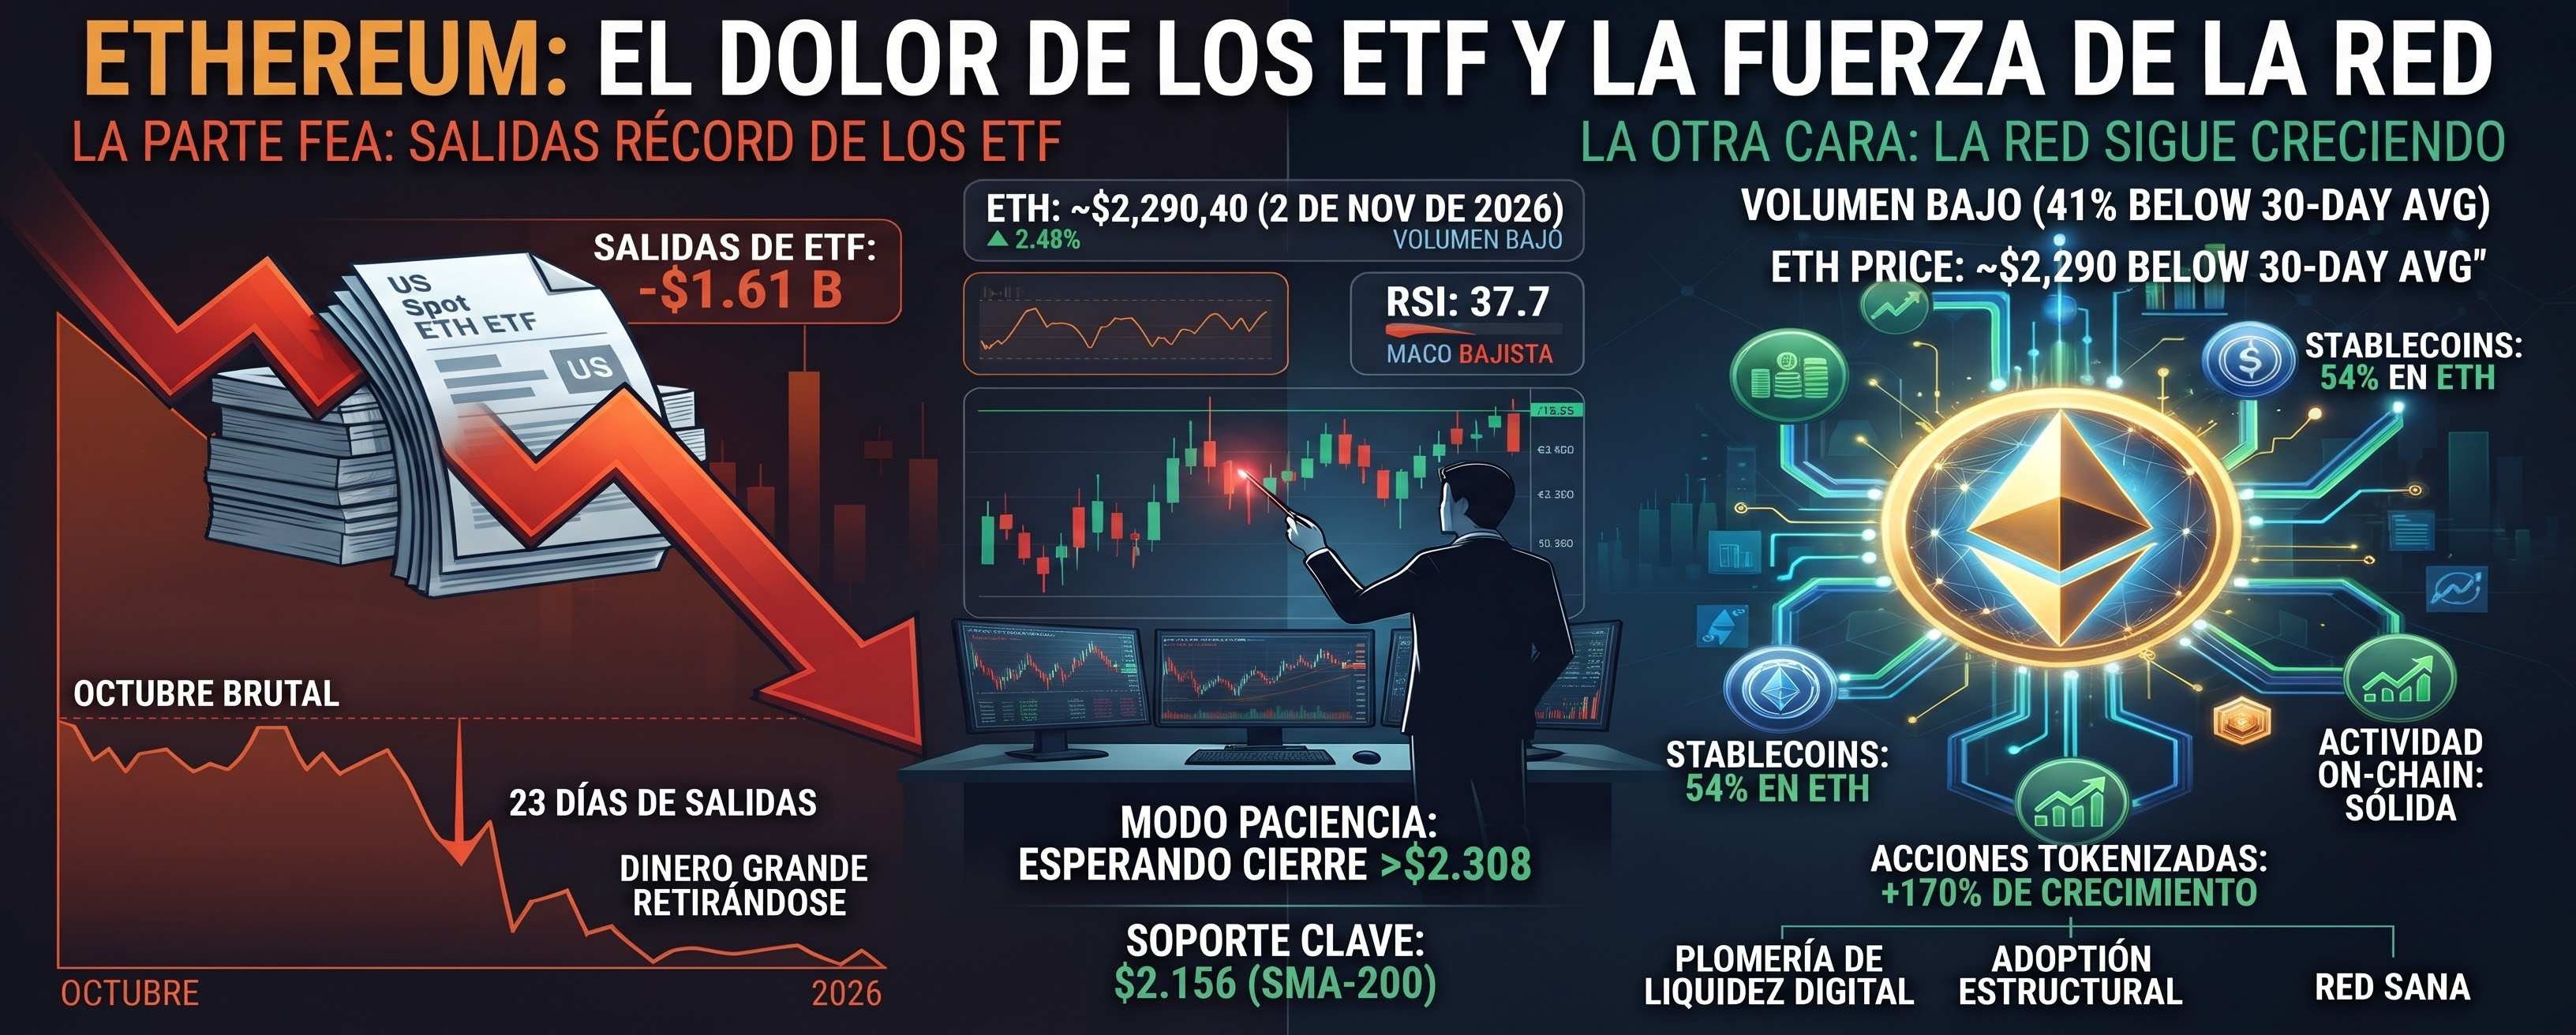

For weeks, I've been hearing the same headline: "Ethereum ETFs are bleeding." And it's true—October was brutal. But when you've been in this for a while, you learn something uncomfortable: the price and the health of a network don't always tell the same story. Today I want to show you both sides of the ledger, because I think a lot of people are only reading half of it.
Here's what I'm seeing as of the close on November 2, 2026, with ETH at ~$2,290.
1️⃣ 📉 The ugly side: the ETFs' worst month since their debut
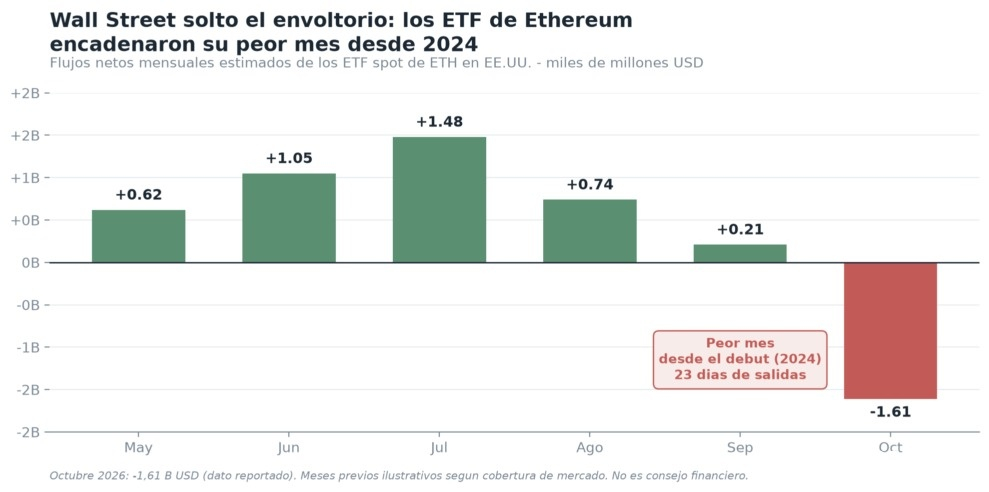
I'm not going to sugarcoat it. U.S. spot ETH ETFs logged 23 straight days of outflows and ended October with their worst monthly net flows since launching in 2024 (a reported outflow of around -$1.61B).
This broke a streak of inflows that had been sustaining the institutional narrative. When the “big money” pulls its chips off the table, rallies tend to be shorter-lived and run out of fuel. It’s a signal I respect, not one I ignore (see first chart: monthly flows).
2️⃣ 🔍 Today's bounce: real, but fragile
ETH rose +2.48% during the session, to $2,290.40. Sounds good… until you look under the hood:
📊 Volume of ~$6.64B, 41% below its 30-day average. A bounce without volume is a bounce without conviction.
📐 RSI at 37.7 and MACD still bearish: momentum is still battered.
The price is trading below almost all its moving averages (from the 7-day to the 90-day).
Honest translation: this looks more like a pause than a trend reversal. For now.
3️⃣ 🏗️ The other side of the ledger: the network keeps gaining ground
This is where most people stop reading, and to me it’s the most interesting part. While the wrapper (the ETF) was seeing outflows, the network kept working:
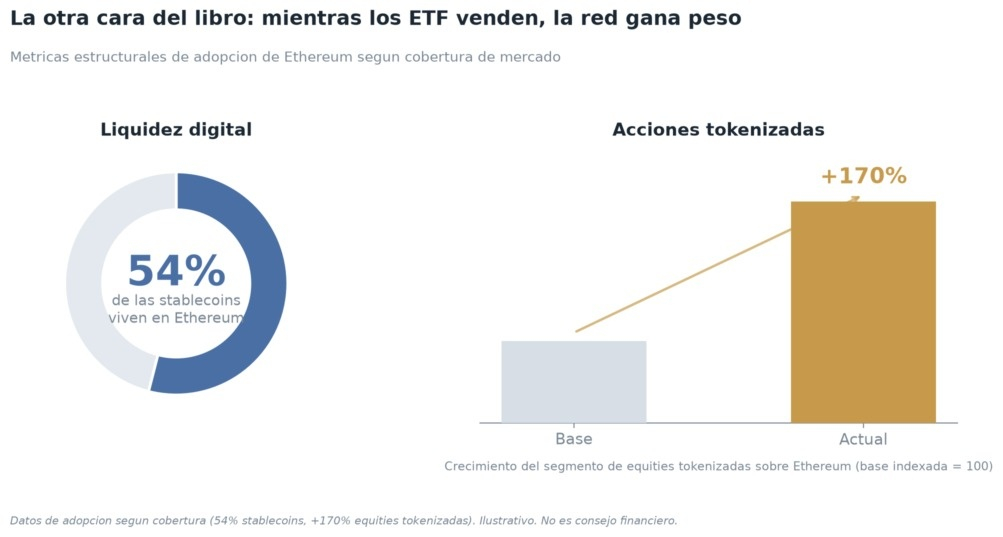
🪙 ~54% of all stablecoins live on Ethereum. It’s the plumbing of digital liquidity.
📈 Tokenized stocks grew by around +170% on the network.
Selling an ETF is a portfolio move. It doesn’t shut down on-chain activity. And that divergence between financial flows and real-world usage is, to me, the real story of this cycle (see third chart: digital liquidity + tokenization).
4️⃣ 🎯 The levels I’m watching
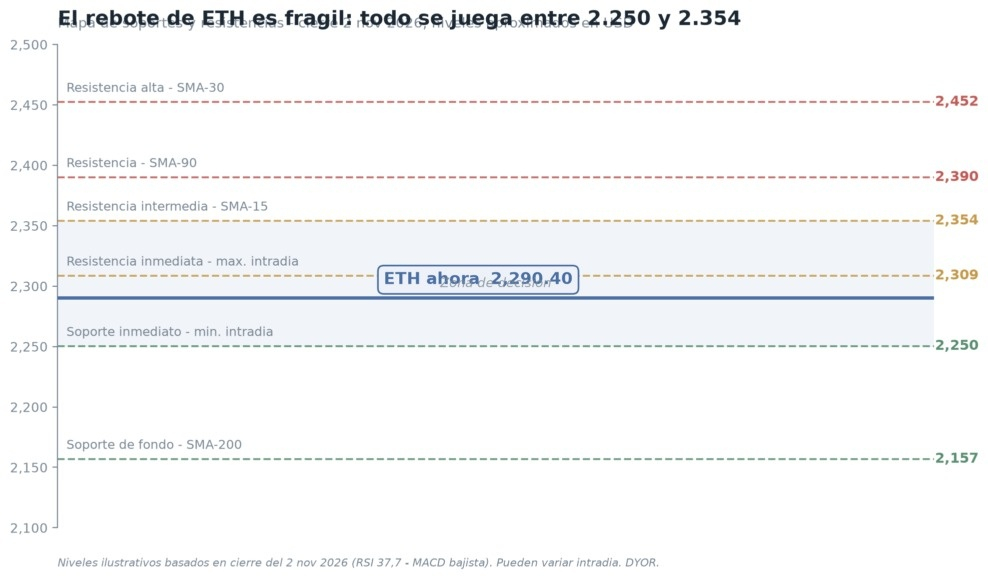
It all comes down to a narrow range (second chart):
🟥 Immediate resistance: $2,308 → without a close above it on volume, I’m not getting excited.
🟧 Key resistance: $2,354 (SMA-15). Breaking above it would genuinely improve the short-term structure.
🟩 Immediate support: $2,250. Losing it would weaken the entire bounce.
🟩 Long-term support: $2,156 (SMA-200). This is my “time to reassess the thesis” line.
⚠️ Risks I can’t ignore
ETF selling pressure could continue and derail any recovery.
Weak volume = breakouts can easily turn out to be false.
The macro backdrop (U.S. employment, midterm elections, the noise around the hack of a major exchange) could move the market more than any technical chart.
Adoption data is structural context, not an immediate price catalyst. Don’t confuse “healthy network” with “going up tomorrow.”
🧭 My conclusion (in my own words)
I’m neither euphoric nor panicking: I’m in patience mode. Until I see a firm close above
2.308
–
2.308–2.354 accompanied by volume, I’m treating this bounce as tactical, not structural. If it loses $2,250 and heads toward the SMA-200 at $2,156, I’ll reduce exposure and wait. The network’s strength tells me the long-term thesis is still alive; the chart tells me it’s still not the time to chase.
Staggered entries, a stop defined before entering, and zero FOMO. That’s what’s kept me in the game.
💬 I'll leave it to you: do you see the ETF outflows as the beginning of something uglier, or as the capitulation that usually comes before a bottom? Let me know below. 👇