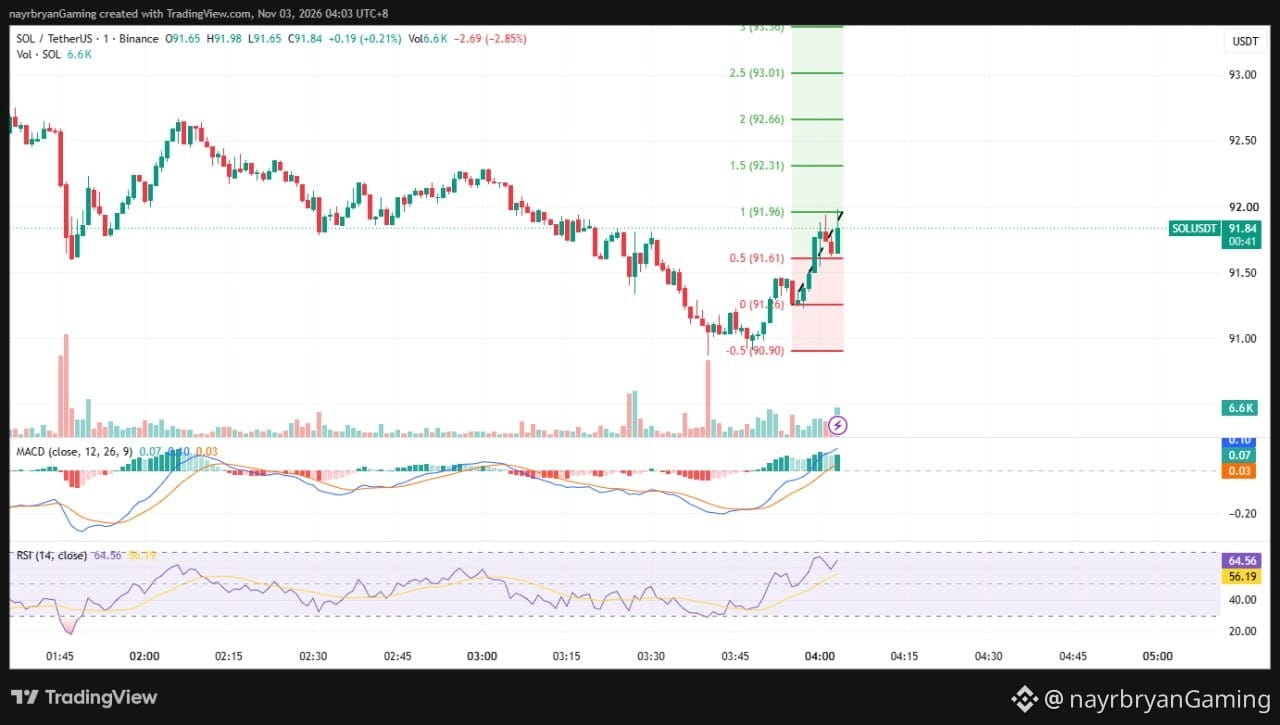
LIGHT ANALYSIS / CHART SETUP — SOL/USDT
📈 Structure Overview
Market phase:
Downtrend → Support reaction → Bullish recovery
Current price:
91.84
Immediate support:
91.61
Key support:
91.26
Major downside:
90.90
Key resistance:
91.96
Next upside levels:
92.31 → 92.66 → 93.01 → 93.36 → 93.71
---
📌 What I'm Watching
Scenario A — Bullish Continuation
If SOL maintains support above 91.61 and successfully reclaims 91.96, price may rotate toward:
92.31 → 92.66 → 93.01 → 93.36 → 93.71
A sustained breakout above 91.96 would strengthen the recovery structure.
---
Scenario B — Pullback / Support Failure
If SOL gets rejected around 91.96 and loses 91.61, the next important support becomes:
91.26
A further breakdown below 91.26 could expose the 90.90 liquidity area.
---
📊 Indicator Check
MACD:
Positive momentum, bullish crossover structure.
RSI:
64.56 → bullish momentum, approaching the upper range.
Price:
Recovering from 90.90 toward 91.96.
Confirmation:
91.96 breakout / 91.61 support failure.
---
Note:
This is a chart framework, not a trade recommendation.
Use it to support your own DYOR-based execution plan.
— @nayrbryanGaming
#SOLAnalysis #ChartSetup #PriceAction #SmartMoney #Fibonacci #CryptoTrading #TechnicalAnalysis #DYOR #NFA
📈 Structure Overview
Market phase:
Downtrend → Support reaction → Bullish recovery
Current price:
91.84
Immediate support:
91.61
Key support:
91.26
Major downside:
90.90
Key resistance:
91.96
Next upside levels:
92.31 → 92.66 → 93.01 → 93.36 → 93.71
---
📌 What I'm Watching
Scenario A — Bullish Continuation
If SOL maintains support above 91.61 and successfully reclaims 91.96, price may rotate toward:
92.31 → 92.66 → 93.01 → 93.36 → 93.71
A sustained breakout above 91.96 would strengthen the recovery structure.
---
Scenario B — Pullback / Support Failure
If SOL gets rejected around 91.96 and loses 91.61, the next important support becomes:
91.26
A further breakdown below 91.26 could expose the 90.90 liquidity area.
---
📊 Indicator Check
MACD:
Positive momentum, bullish crossover structure.
RSI:
64.56 → bullish momentum, approaching the upper range.
Price:
Recovering from 90.90 toward 91.96.
Confirmation:
91.96 breakout / 91.61 support failure.
---
Note:
This is a chart framework, not a trade recommendation.
Use it to support your own DYOR-based execution plan.
— @nayrbryanGaming
#SOLAnalysis #ChartSetup #PriceAction #SmartMoney #Fibonacci #CryptoTrading #TechnicalAnalysis #DYOR #NFA