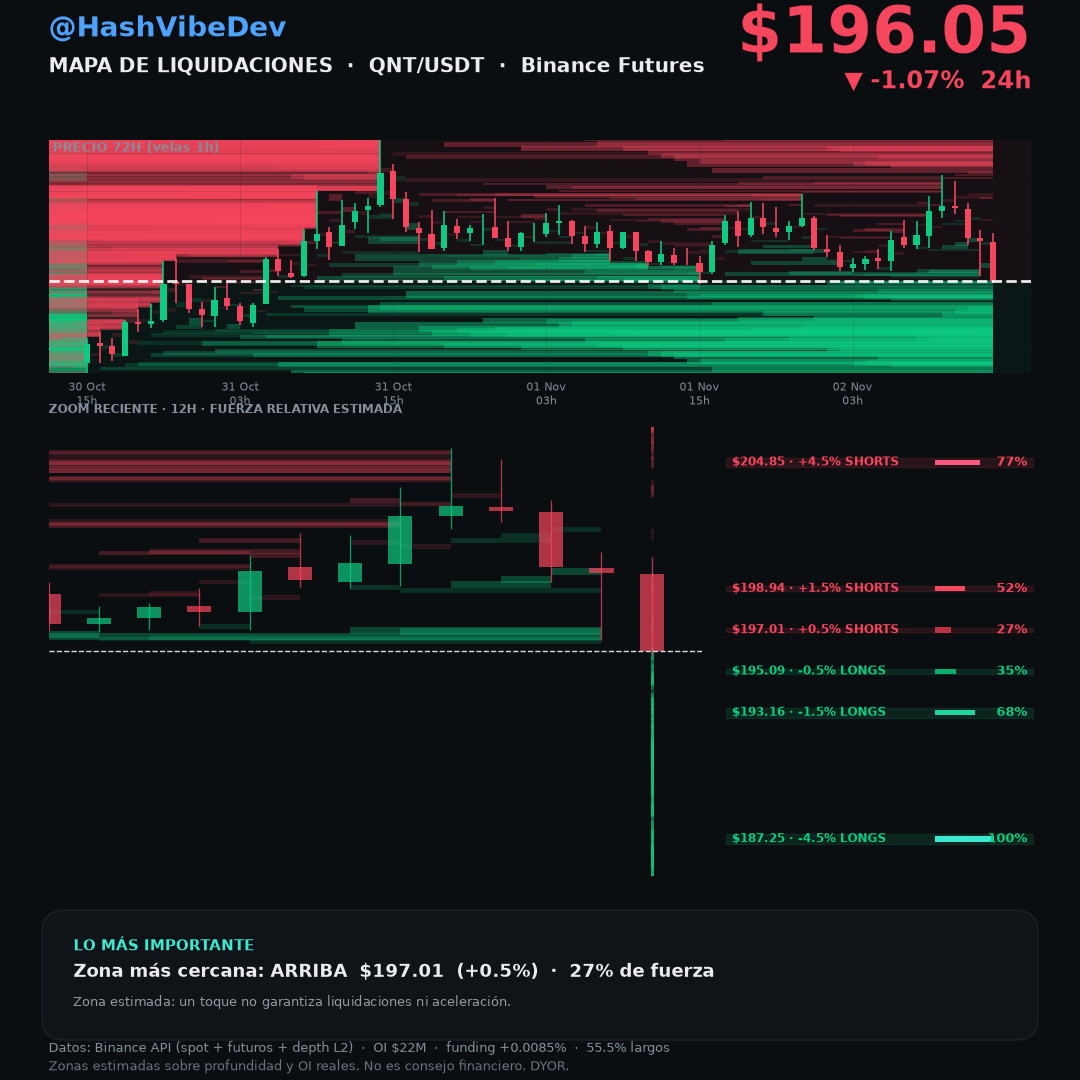
QNT entered the estimated long liquidation zones: bounce or more downside pressure?
Since the previous analysis, the price reached the long reference levels of $198.09 and $196.14, with a low of $195.80 in the completed candles reviewed. These are estimated zones: a touch does not confirm that liquidations occurred.
It also touched $200.05 and $202.00 on the upside; the highest level reviewed was $205.54.
At the time of the analysis, $QNT is trading at $196.05, down 1.07% over 24 hours.
The new map estimates short zones at $197.01, $198.94, and $204.85; and long zones at $195.09, $193.16, and $187.25.
Open interest in contracts fell 3.04% between 18:00 UTC on November 1 and November 2. This figure alone does not identify which positions were opened or closed.
If you're watching this analysis, follow me to keep up with the series. Which direction do you think QNT will take: will it recover $197 or head for the $195.09 zone?
#QNT $QNT
This is not financial advice. DYOR.
Since the previous analysis, the price reached the long reference levels of $198.09 and $196.14, with a low of $195.80 in the completed candles reviewed. These are estimated zones: a touch does not confirm that liquidations occurred.
It also touched $200.05 and $202.00 on the upside; the highest level reviewed was $205.54.
At the time of the analysis, $QNT is trading at $196.05, down 1.07% over 24 hours.
The new map estimates short zones at $197.01, $198.94, and $204.85; and long zones at $195.09, $193.16, and $187.25.
Open interest in contracts fell 3.04% between 18:00 UTC on November 1 and November 2. This figure alone does not identify which positions were opened or closed.
If you're watching this analysis, follow me to keep up with the series. Which direction do you think QNT will take: will it recover $197 or head for the $195.09 zone?
#QNT $QNT
This is not financial advice. DYOR.