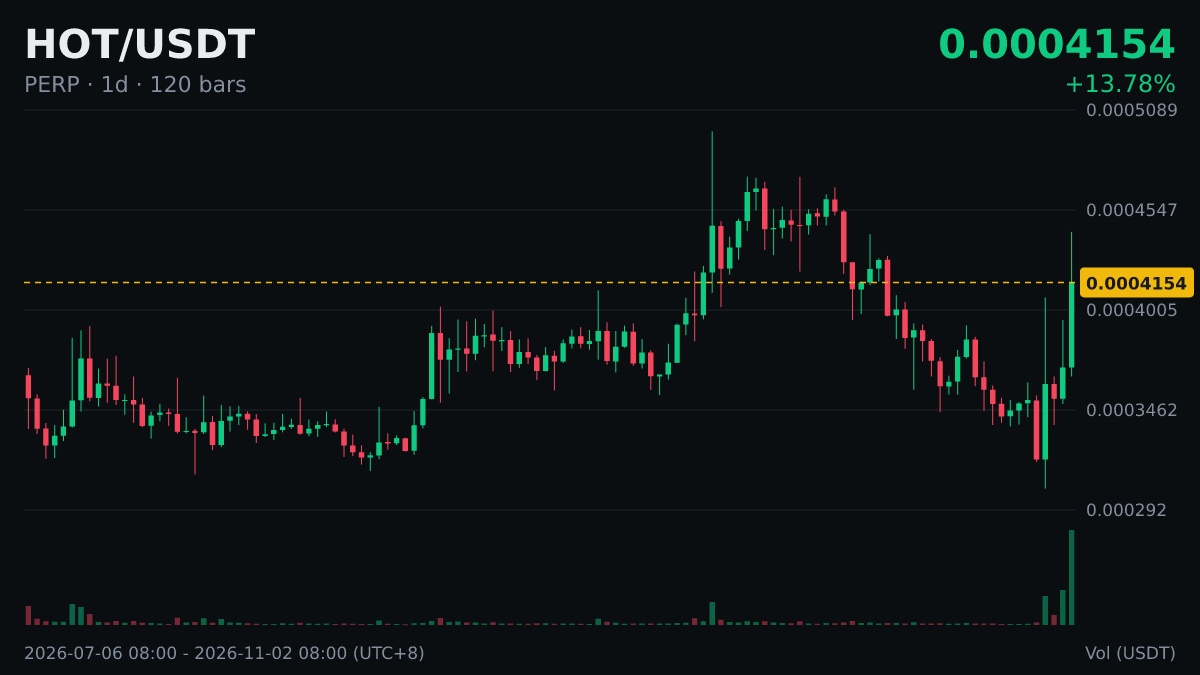
🐋 $HOT has moved above MA200 on the daily chart (0.0003727).
The moving average on the daily chart is a level many medium- and long-term investors watch, so let’s first understand what it is.
There are two types of moving averages: simple and exponential. MA usually refers to a simple moving average, where each candlestick has equal weight; EMA gives more weight to recent prices.
An intraday move above the average and confirmation at the daily close are two different things: it’s more convincing if the price is still above the average after the close.
Keep enough margin for leveraged positions, and don’t let one sudden price swing liquidate your position.
The moving average on the daily chart is a level many medium- and long-term investors watch, so let’s first understand what it is.
There are two types of moving averages: simple and exponential. MA usually refers to a simple moving average, where each candlestick has equal weight; EMA gives more weight to recent prices.
An intraday move above the average and confirmation at the daily close are two different things: it’s more convincing if the price is still above the average after the close.
Keep enough margin for leveraged positions, and don’t let one sudden price swing liquidate your position.