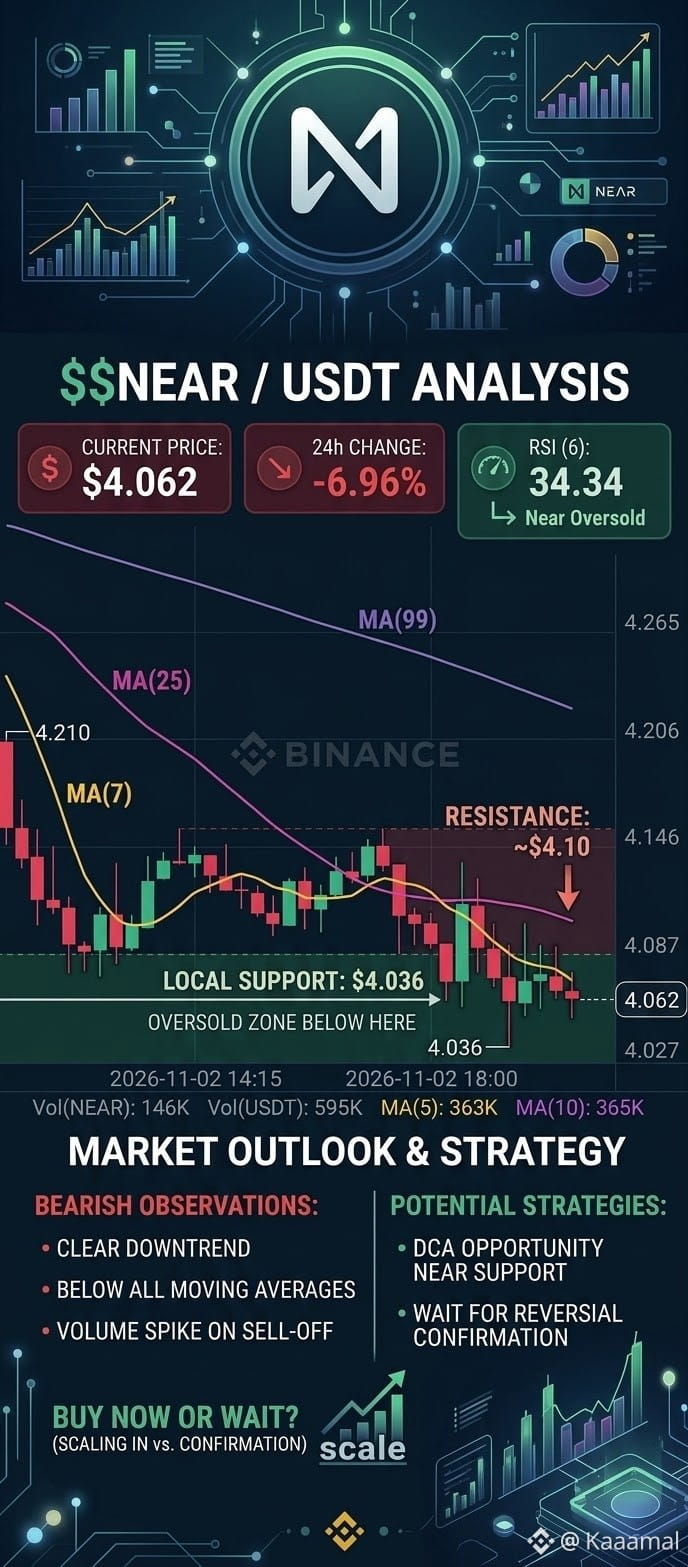
p $NEAR / USDT Technical Analysis (15M Chart)
Current Price: $4.062
24h Range: $4.036 – $4.366
24h Change: -6.96%
1. Market Structure & Trend
Short-Term Bearish Pressure: The 15-minute chart displays a clear downward trend following a rejection from higher levels. Price is trading below the key Moving Averages 25), showing that sellers are currently in control of the short-term momentum.
Support Testing: $NEAR is hovering just above its local 24-hour low of $4.036. This zone is acting as an immediate psychological and technical floor. If this support fails, we could see an acceleration toward the psychological $4.00 round number.
2. Technical Indicators
RSI (Relative Strength Index): The 6-period RSI is reading 34.34, placing it near the edge of the oversold territory. This suggests that while the momentum is heavily bearish, the asset is stretched to the downside and is due for a short-term relief bounce or consolidation phase.
💡 Should You "Buy It Now"?
The Risk of Buying the Falling Knife: Jumping in right now carries aggressive risk because the momentum is still pointing down, and it hasn't established a confirmed reversal pattern on higher timeframes.
The DCA / Accumulation Play: Because the RSI is cooling down near oversold levels (~34) and testing a key 24h low ($4.036), spot accumulators looking for a mid-to-long-term entry might consider scaling in with small DCA (Dollar-Cost Averaging) tranches, rather than going all-in at once.
Conservative Setup: Wait for a clear confirmation signal—such as a 15M/1H candle close back above the short-term moving averages or a higher low formation—before executing a heavier entry. Always set a strict stop-loss below the $4.00 support level if you are trading leverage or short-term swings.
Disclaimer: Crypto markets are volatile. This technical breakdown is for educational and informational purposes only and does not constitute financial advice. Always do your own research and manage your risk.
Current Price: $4.062
24h Range: $4.036 – $4.366
24h Change: -6.96%
1. Market Structure & Trend
Short-Term Bearish Pressure: The 15-minute chart displays a clear downward trend following a rejection from higher levels. Price is trading below the key Moving Averages 25), showing that sellers are currently in control of the short-term momentum.
Support Testing: $NEAR is hovering just above its local 24-hour low of $4.036. This zone is acting as an immediate psychological and technical floor. If this support fails, we could see an acceleration toward the psychological $4.00 round number.
2. Technical Indicators
RSI (Relative Strength Index): The 6-period RSI is reading 34.34, placing it near the edge of the oversold territory. This suggests that while the momentum is heavily bearish, the asset is stretched to the downside and is due for a short-term relief bounce or consolidation phase.
💡 Should You "Buy It Now"?
The Risk of Buying the Falling Knife: Jumping in right now carries aggressive risk because the momentum is still pointing down, and it hasn't established a confirmed reversal pattern on higher timeframes.
The DCA / Accumulation Play: Because the RSI is cooling down near oversold levels (~34) and testing a key 24h low ($4.036), spot accumulators looking for a mid-to-long-term entry might consider scaling in with small DCA (Dollar-Cost Averaging) tranches, rather than going all-in at once.
Conservative Setup: Wait for a clear confirmation signal—such as a 15M/1H candle close back above the short-term moving averages or a higher low formation—before executing a heavier entry. Always set a strict stop-loss below the $4.00 support level if you are trading leverage or short-term swings.
Disclaimer: Crypto markets are volatile. This technical breakdown is for educational and informational purposes only and does not constitute financial advice. Always do your own research and manage your risk.