The short- to medium-term battle over ETH this round is essentially a tug-of-war between long-term on-chain holders absorbing supply, whales accumulating in batches, and institutions continuing to redeem ETF shares. At the macro level, U.S. Treasuries, the dollar, and risk appetite in U.S. equities remain the master switches for the broader market. Within this same market move, capital is rotating from ETH into BTC, which is also the main reason ETH has often underperformed the broader market recently. ETH/BTC is our most important gauge for determining whether ETH can make an independent move.
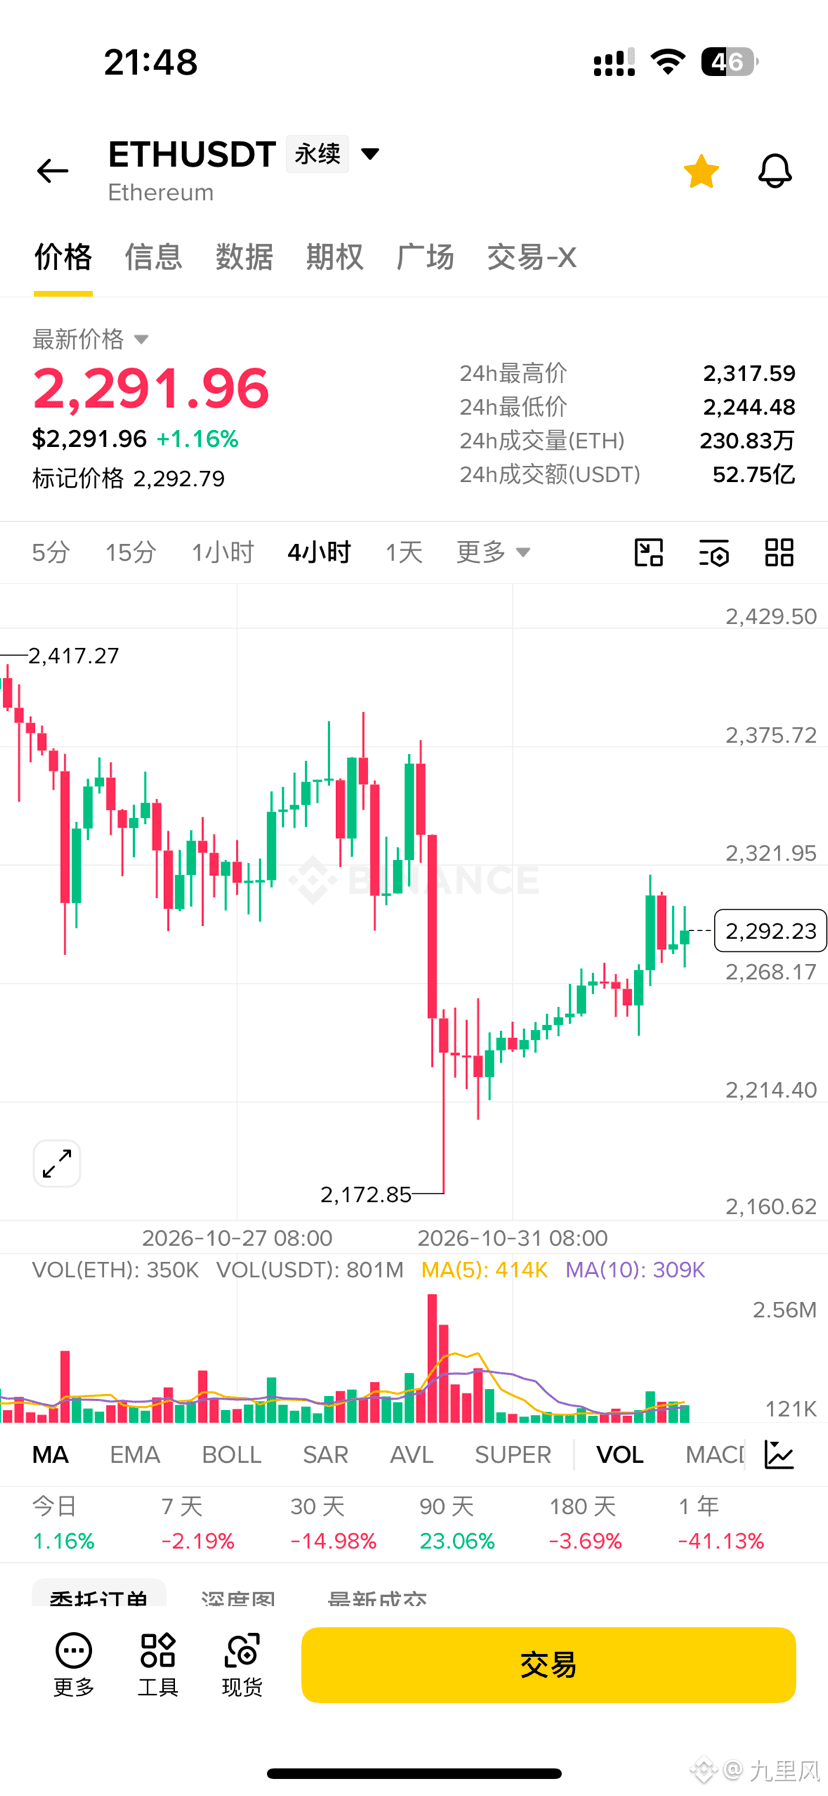
Technically, price has repeatedly tested both sides of its range over the past few days, showing clear signs of consolidation. Buyers have supported the lows after declines, but each rally into a cluster of resistance has lacked volume, making sustained upward momentum difficult to achieve. Long upper wicks and frequent false breakouts are typical signs of weak consolidation.
The key positioning zone is 2210–2245, a demand area formed by recent lows and a convergence of moving averages. Don’t place entry orders in advance; ideally, wait for two confirmations: BTC holds key support, and the 4H chart prints a reversal candle signaling that the decline has stalled, followed by stabilization on rising volume after a period of declining volume. Set the defensive level at 2150. A decisive daily close below this level would mean support has failed, and the bullish thesis should be set aside for now. Take profits in stages: the first target is 2320–2340, where you should reduce your position and realize some gains. If price holds above 2340 on rising volume, you can add a small amount after a confirmed retest, with the next target at 2440–2460. Only a shift from ETF outflows to inflows, together with a high-volume break above 2400, would create an opportunity for a move into higher territory. #ETH (the second-largest coin)
Technically, price has repeatedly tested both sides of its range over the past few days, showing clear signs of consolidation. Buyers have supported the lows after declines, but each rally into a cluster of resistance has lacked volume, making sustained upward momentum difficult to achieve. Long upper wicks and frequent false breakouts are typical signs of weak consolidation.
The key positioning zone is 2210–2245, a demand area formed by recent lows and a convergence of moving averages. Don’t place entry orders in advance; ideally, wait for two confirmations: BTC holds key support, and the 4H chart prints a reversal candle signaling that the decline has stalled, followed by stabilization on rising volume after a period of declining volume. Set the defensive level at 2150. A decisive daily close below this level would mean support has failed, and the bullish thesis should be set aside for now. Take profits in stages: the first target is 2320–2340, where you should reduce your position and realize some gains. If price holds above 2340 on rising volume, you can add a small amount after a confirmed retest, with the next target at 2440–2460. Only a shift from ETF outflows to inflows, together with a high-volume break above 2400, would create an opportunity for a move into higher territory. #ETH (the second-largest coin)