#以太坊 These indicators are pretty interesting:
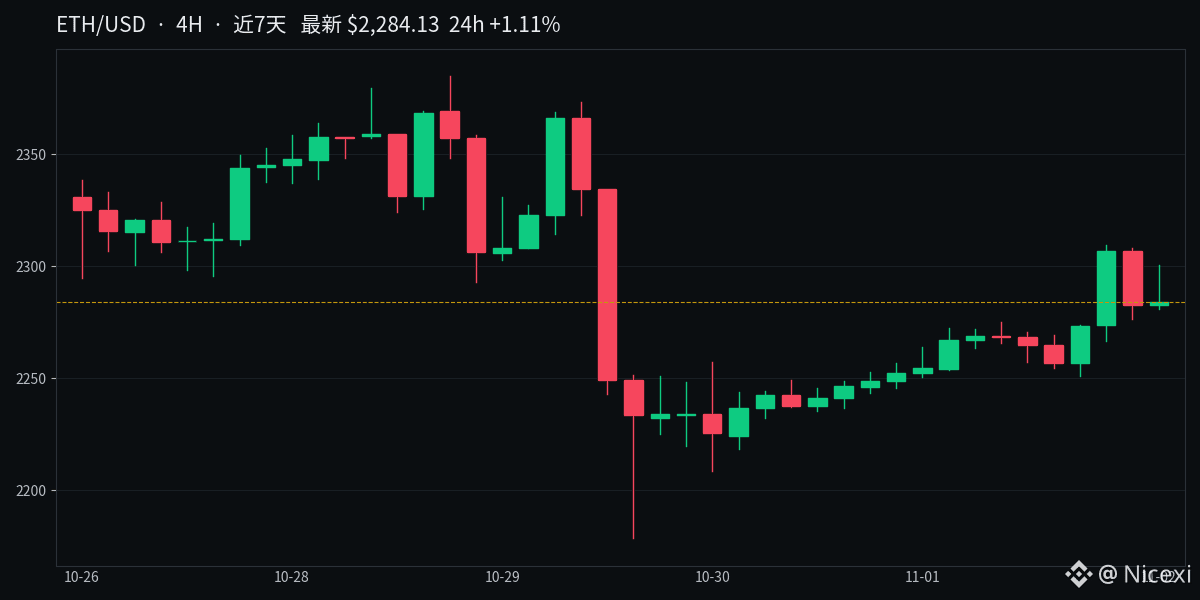
$ETH The current price is $2,285, up 1.09% over 24h. RSI (14) is 52.7, hovering around the midpoint—not overbought or oversold, with neither bulls nor bears gaining an edge.
As for the moving averages, MA7 at 2,277 is above MA25 at 2,265, and the price is above both lines. The short-term structure is still slightly bullish, but the gap hasn’t widened much.
The MACD is interesting: DIF is still below the zero line at -3.2, but the histogram is positive at 13.7, suggesting bearish momentum is fading. If DIF continues upward and crosses DEA, that would confirm momentum is recovering. On the other hand, if the histogram turns negative and RSI falls back below 50, watch out for a short-term pullback.
The 7-day trading range is 2,179–2,385, and the price is now in the middle. Whether the indicators recover or deteriorate will depend on the next couple of days.
$ETH The current price is $2,285, up 1.09% over 24h. RSI (14) is 52.7, hovering around the midpoint—not overbought or oversold, with neither bulls nor bears gaining an edge.
As for the moving averages, MA7 at 2,277 is above MA25 at 2,265, and the price is above both lines. The short-term structure is still slightly bullish, but the gap hasn’t widened much.
The MACD is interesting: DIF is still below the zero line at -3.2, but the histogram is positive at 13.7, suggesting bearish momentum is fading. If DIF continues upward and crosses DEA, that would confirm momentum is recovering. On the other hand, if the histogram turns negative and RSI falls back below 50, watch out for a short-term pullback.
The 7-day trading range is 2,179–2,385, and the price is now in the middle. Whether the indicators recover or deteriorate will depend on the next couple of days.