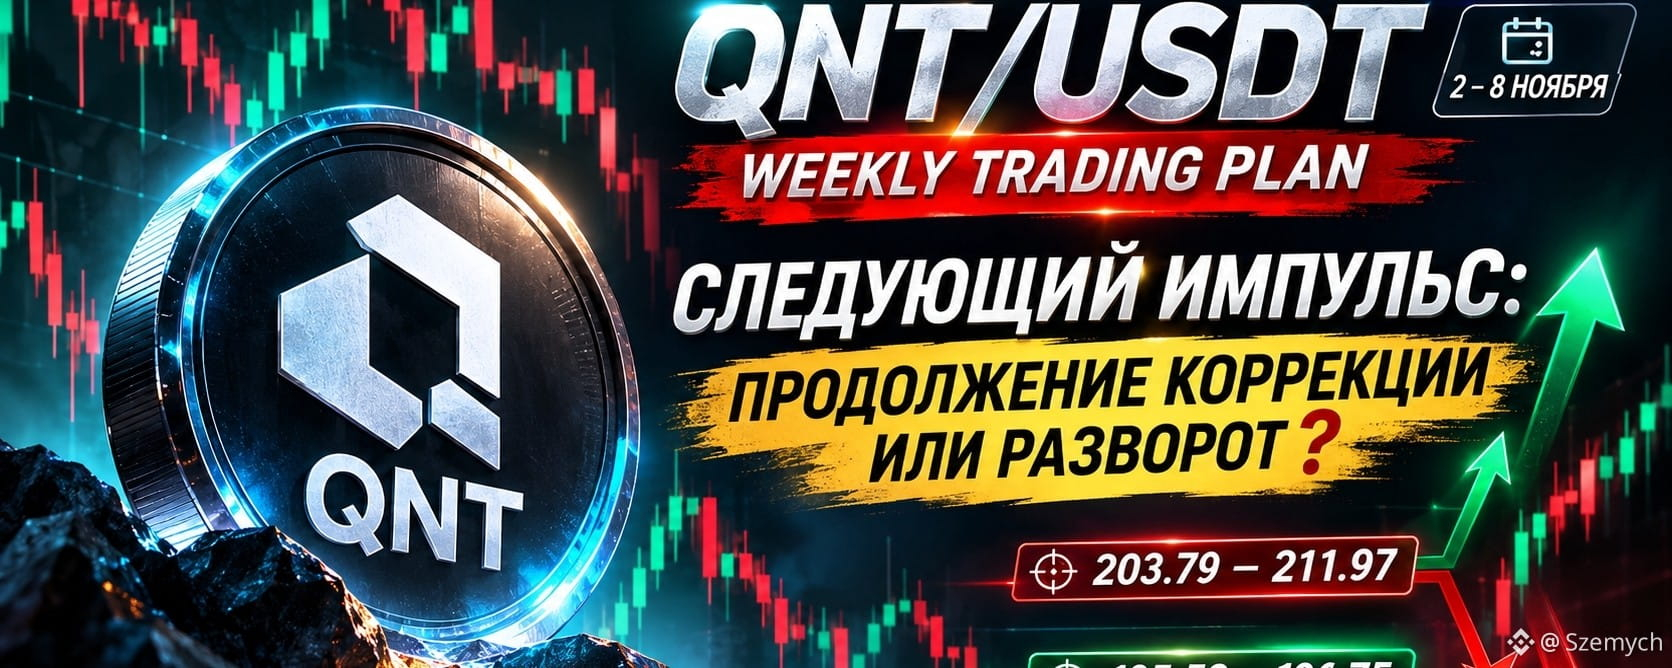

 $QNT/USDT is approaching a critical decision point. After an explosive rally to 374.50 USDT, the market underwent a major correction, and the latest recovery attempt from 173.30 has yet to return control to buyers.
The price is currently around 197.57 USDT. But the key issue isn’t the price level itself—it’s which liquidity the market will take next.
Let’s break down the scenarios for the week of November 2–8.
🔎 1. HTF CONTEXT — W1 / D1
On the higher timeframe, a pronounced corrective structure remains in place following the extreme impulse from the 50–55 USDT area to 374.50 USDT.
A strong bearish Delivery followed the sweep of liquidity above the all-time high.
On D1, price has not yet demonstrated a full recovery of bullish structure.
The latest move from 173.30 to 211.97 was a local recovery attempt, but buying failed to continue.
Current HTF Bias: NEUTRAL → BEARISH.
📊 2. H4 — MARKET STRUCTURE & LIQUIDITY
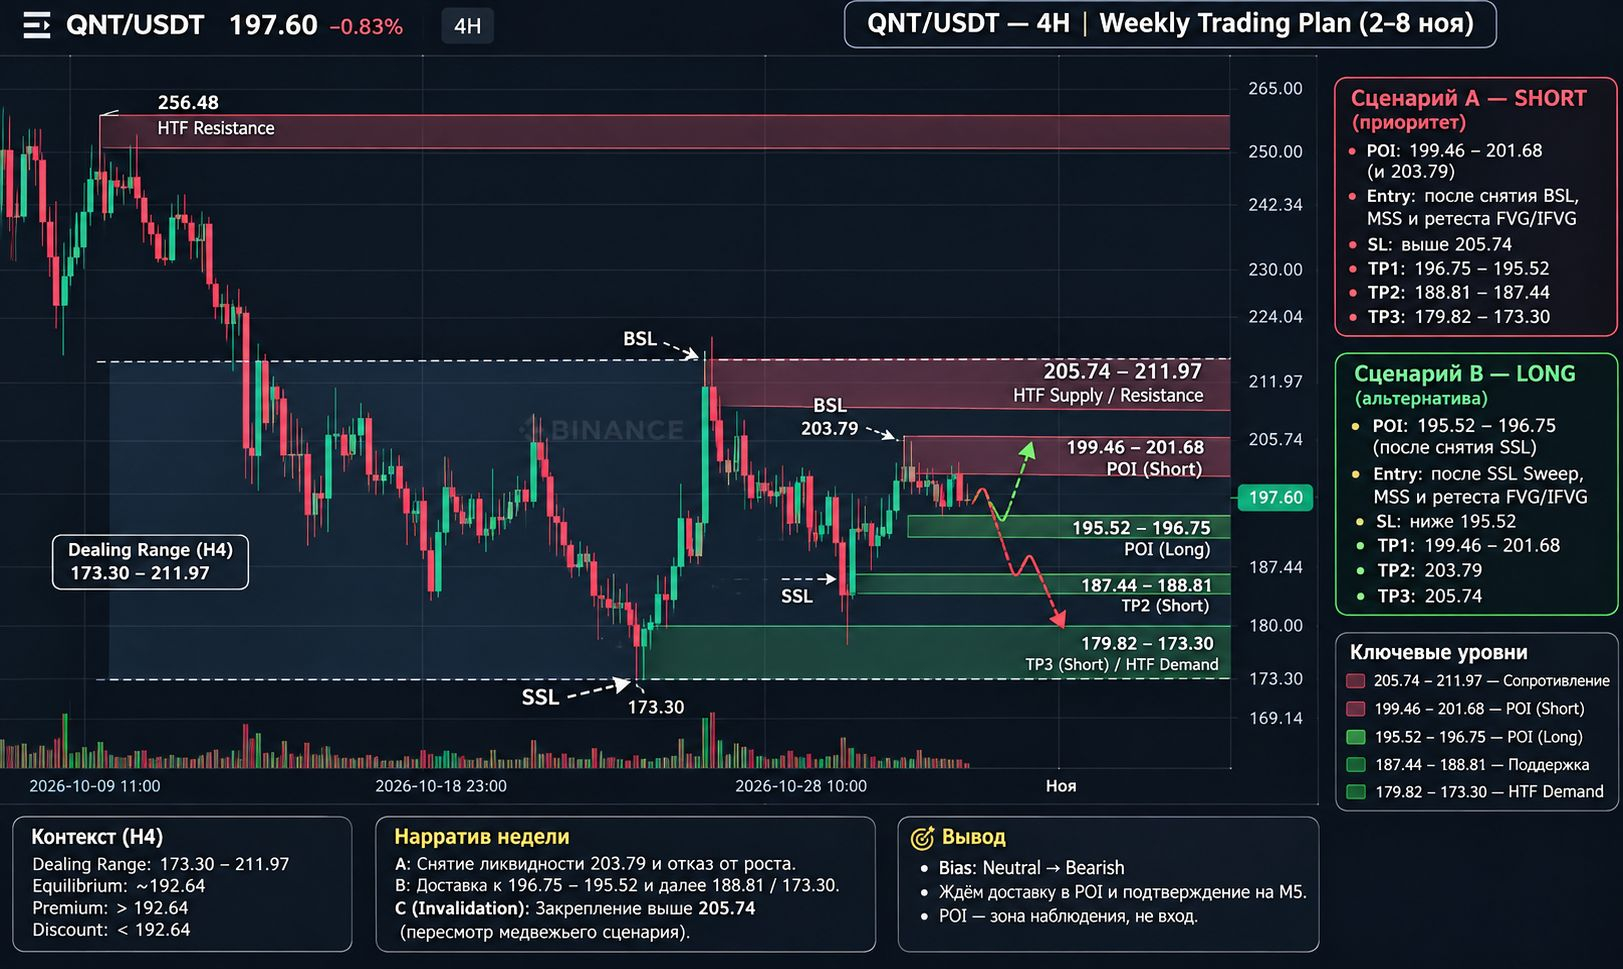
Key Dealing Range:
High: 211.97
Low: 173.30
Equilibrium: 192.64
Price is above Equilibrium but has not yet managed to hold above the 205.74–211.97 area.
Key levels:
🔴 BSL: 203.79 / 205.74–211.97
🟢 SSL: 196.75 / 195.52
🎯 Next downside targets: 188.81–187.44, followed by 179.82–173.30.
The market has already taken liquidity around 173.30, then recovered to 211.97.
However, the subsequent reaction shows that buyers are not yet able to deliver a sustained move higher.
⚡ 3. H1 / M15 — WHAT IS HAPPENING NOW?
The latest local structure looks as follows:
Price formed a high at 203.79.
Buyers failed to hold the upward move.
Bearish Delivery emerged.
Price reached 195.52–196.75.
We are now seeing consolidation around 197.57.
The current local Delivery is headed down toward lower liquidity.
But further downside still needs confirmation.
🎯 4. MAIN SCENARIO — SHORT
I favor looking for a SHORT, but not at the current price.
Narrative A → B
A: Buy-Side Liquidity taken around 203.79, followed by a failure to continue higher.
B: Potential Delivery to 196.75–195.52, and if broken and confirmed—to 188.81–187.44.
POIs to watch:
199.46–201.68
203.79
These are areas of interest, not ready-made entry points.
What is needed for a SHORT?
On M5, we wait for the following sequence:
Price moves into a POI.
Sweep of local Buy-Side Liquidity.
Bearish MSS.
Displacement.
FVG/IFVG Retest.
We consider an entry only after confirmation.
🟢 5. PLAN B — LONG
We cannot rule out an alternative scenario.
If the market takes Sell-Side Liquidity below 196.75–195.52 and forms a bullish change of structure, an opportunity for upward Delivery may emerge.
Narrative A → B
A: Sweep of lower liquidity.
B: Recovery to 199.46–201.68, then 203.79.
POI: 195.52–196.75 and the area where liquidity below it may be taken.
LONG confirmation on M5:
SSL Sweep → Bullish MSS → Displacement → FVG/IFVG Retest.
Without this sequence, there is no entry.
❗ 6. INVALIDATION — WHEN WILL THE BEARISH SCENARIO NO LONGER BE VALID?
A return above 203.79 and a hold there would weaken the SHORT Narrative.
A decisive recovery above 205.74 would require reassessing the local Bias.
Acceptance above 211.97 would be grounds to reassess the H4 context.
A single wick above a level does not confirm a change in structure.
🛡️ 7. RISK MANAGEMENT
ENTRY / SL / TP / RR are not set yet.
At the moment, there is no confirmed M5 trigger.
We need to wait for the structure to form, determine the invalidation point, and only then calculate the risk and potential profit.
POI ≠ ENTRY.
🔥 MY CONCLUSION
$QNT is caught between two important liquidity pools.
Above: 203.79 and 205.74–211.97.
Below: 196.75 and 195.52, beyond which a potential path opens toward 188.81–187.44.
My current Bias: NEUTRAL → BEARISH.
The main focus is on a SHORT after confirmation. LONG remains an alternative if lower liquidity is taken and a bullish MSS forms.
Until the market shows its direction, the best position is WAIT.
Don’t chase price. Don’t trade assumptions. Wait for liquidity, confirmation of structure, and quality Delivery.
💬 Which level will the market take first: 195.52 below or 203.79 above? Share your scenario in the comments.
#QNT #Quant #CryptoTrading #BinanceSquare #TechnicalAnalysis