


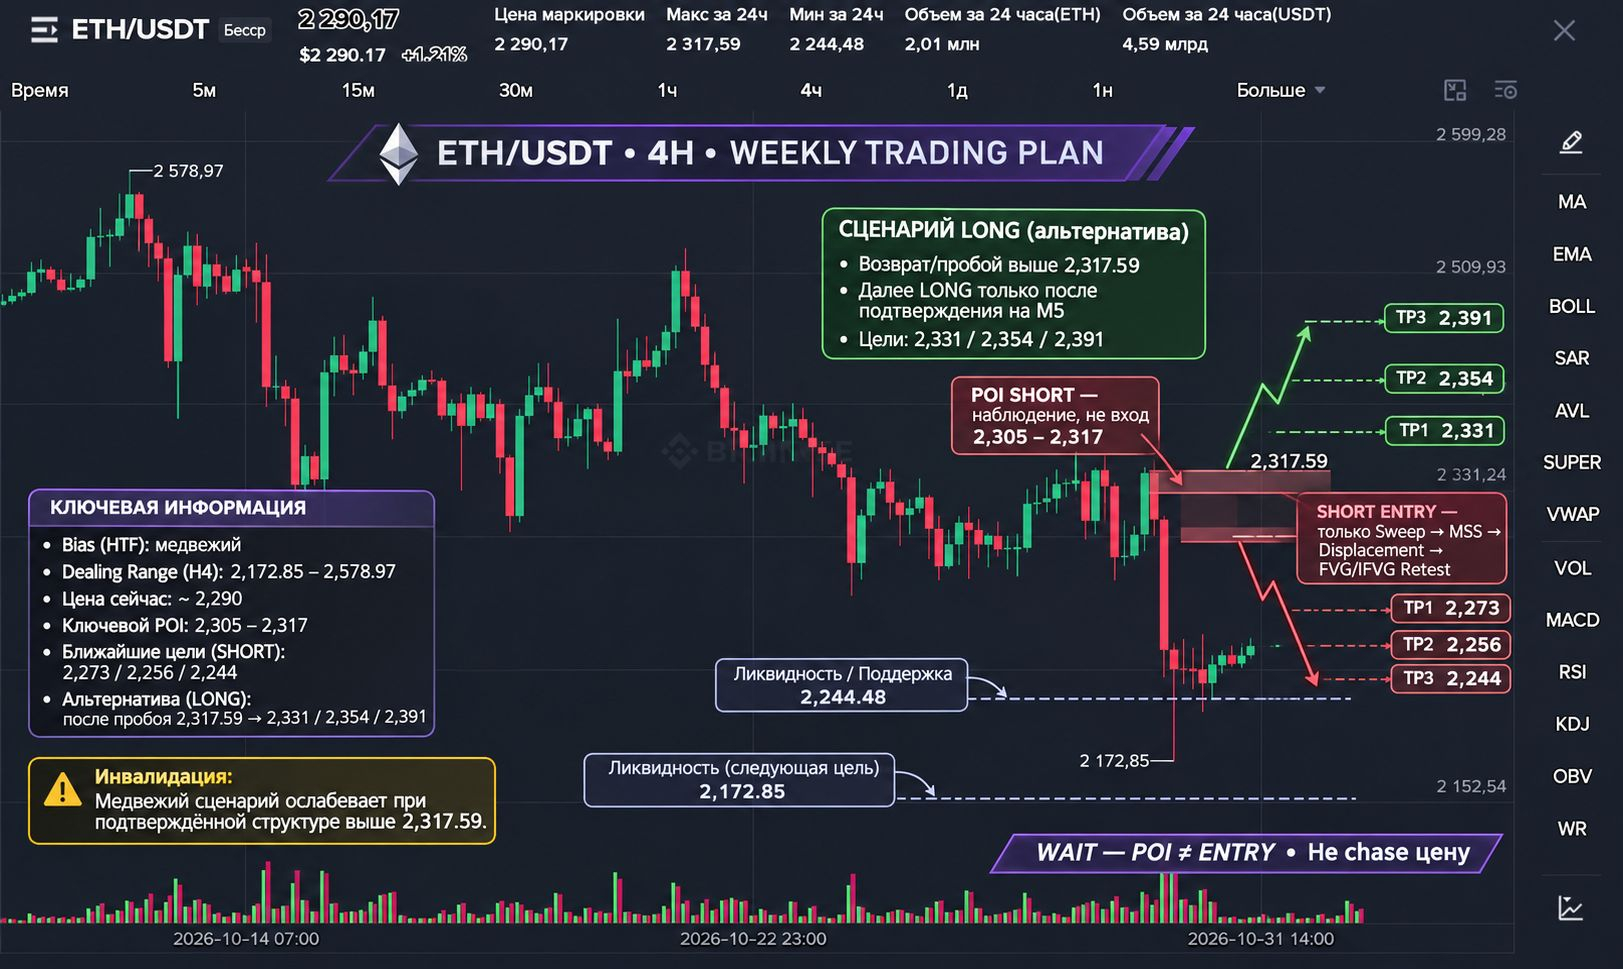
 #Ethereum $ETH/USDT — WEEKLY TRADING PLAN
⚠️ ETH ran into a seller at $2,317. The next move could bring the price back to $2,244!
Current price: $2,289
ETH is showing a local recovery after taking Sell-Side Liquidity, but the higher-timeframe structure does not yet confirm a full reversal. The market is now at a key decision point: continued correction or a resumption of bullish delivery.
Let's break down the key scenarios.
1. HTF CONTEXT — W1 → D1
W1: The global structure remains bearish. After forming a high near $4,957, the market shifted into a sequence of lower highs and lower lows. The data presented offers no convincing confirmation of a change in the global structure.
D1: After recovering from $1,510 to $2,806, ETH formed a downward sequence. The latest price, around $2,289, has not yet changed the daily character of the price action.
Conclusion: HTF Bias — BEARISH. We view the local rise as a recovery within a broader downtrend until buyers prove otherwise.
2. H4 — MARKET STRUCTURE
Key range:
Swing High: $2,578.97
Swing Low: $2,172.85
Current price: $2,289
Price is in the lower part of the H4 Dealing Range — Discount.
After declining to $2,172, the market recovered, but has not yet reclaimed the key $2,331–$2,420 area.
This means the local bullish reaction is not yet confirmation of an HTF reversal.
3. LIQUIDITY & NARRATIVE
What the market has already done:
On lower timeframes, price swept Sell-Side Liquidity around $2,244.48, followed by an impulsive rise to $2,317.59.
This indicates a buyer reaction after liquidity was collected.
Where the current Delivery is coming from:
From the local high of $2,317.59, the market shifted into a corrective move. On M15 and M5, we see the upward impulse weakening and local selling pressure.
NARRATIVE A → B:
A — reaction after sweeping SSL near $2,244.
B — potential delivery downward to $2,273, then $2,256–$2,244 to test the remaining liquidity.
INVALIDATION C:
A decisive close above $2,317.59, with structure confirmation and continued upward Delivery, would weaken the primary bearish scenario.
4. KEY LEVELS
Resistance / Buy-Side Liquidity:
$2,305–$2,317 — nearest supply zone and local highs.
$2,331 — next resistance area.
$2,354–$2,391 — next targets if the bullish scenario develops.
Support / Sell-Side Liquidity:
$2,273 — first local area of interest.
$2,256 — intermediate support.
$2,244.48 — key local low.
$2,172.85 — next HTF target if the decline continues.
5. POI ≠ ENTRY
Primary POI to watch: $2,305–$2,317.
Here, we need to assess the price reaction and the possibility of a new bearish impulse forming.
SHORT conditions:
Sweep of local Buy-Side Liquidity.
Confirmed MSS on M5.
Downward displacement.
Formation of an FVG/IFVG.
Retest of the zone and confirmation that Delivery is continuing.
We consider an Entry only after this sequence.
Important: Simply touching the POI is not a signal to open a position.
6. MAIN SCENARIO — SHORT
If price fails to reclaim $2,305–$2,317 and forms a confirmed bearish structure on M5, we expect the correction to continue.
Target sequence:
TP1: $2,273
TP2: $2,256
TP3: $2,244
If selling pressure intensifies, further delivery to $2,172 is possible.
We are not setting Entry, SL, or RR yet: there is no confirmed entry point on the charts provided.
7. PLAN B — LONG
If buyers sweep liquidity above $2,317.59, form a bullish MSS and displacement on M5, then hold the FVG/IFVG on the retest, we will consider an alternative LONG.
Potential targets:
$2,331
$2,354
$2,391
A close above $2,317.59 alone is not enough to enter. A confirmed structure is required.
8. FINAL VERDICT
HTF Bias: BEARISH
LTF: local correction following an upward reaction.
Focus on the reaction in the $2,305–$2,317 area and price behavior around $2,273.
Until there is confirmation on M5 — WAIT.
Don't chase price after an impulse. Don't open a position just because price has reached the POI.
The market must first show which liquidity it intends to take and where the next Delivery will begin.
My plan: confirmation first, execution second.
Which scenario do you think is more likely for ETH this week — a continued decline to $2,244 or a recovery above $2,317?
Share your analysis in the comments!


