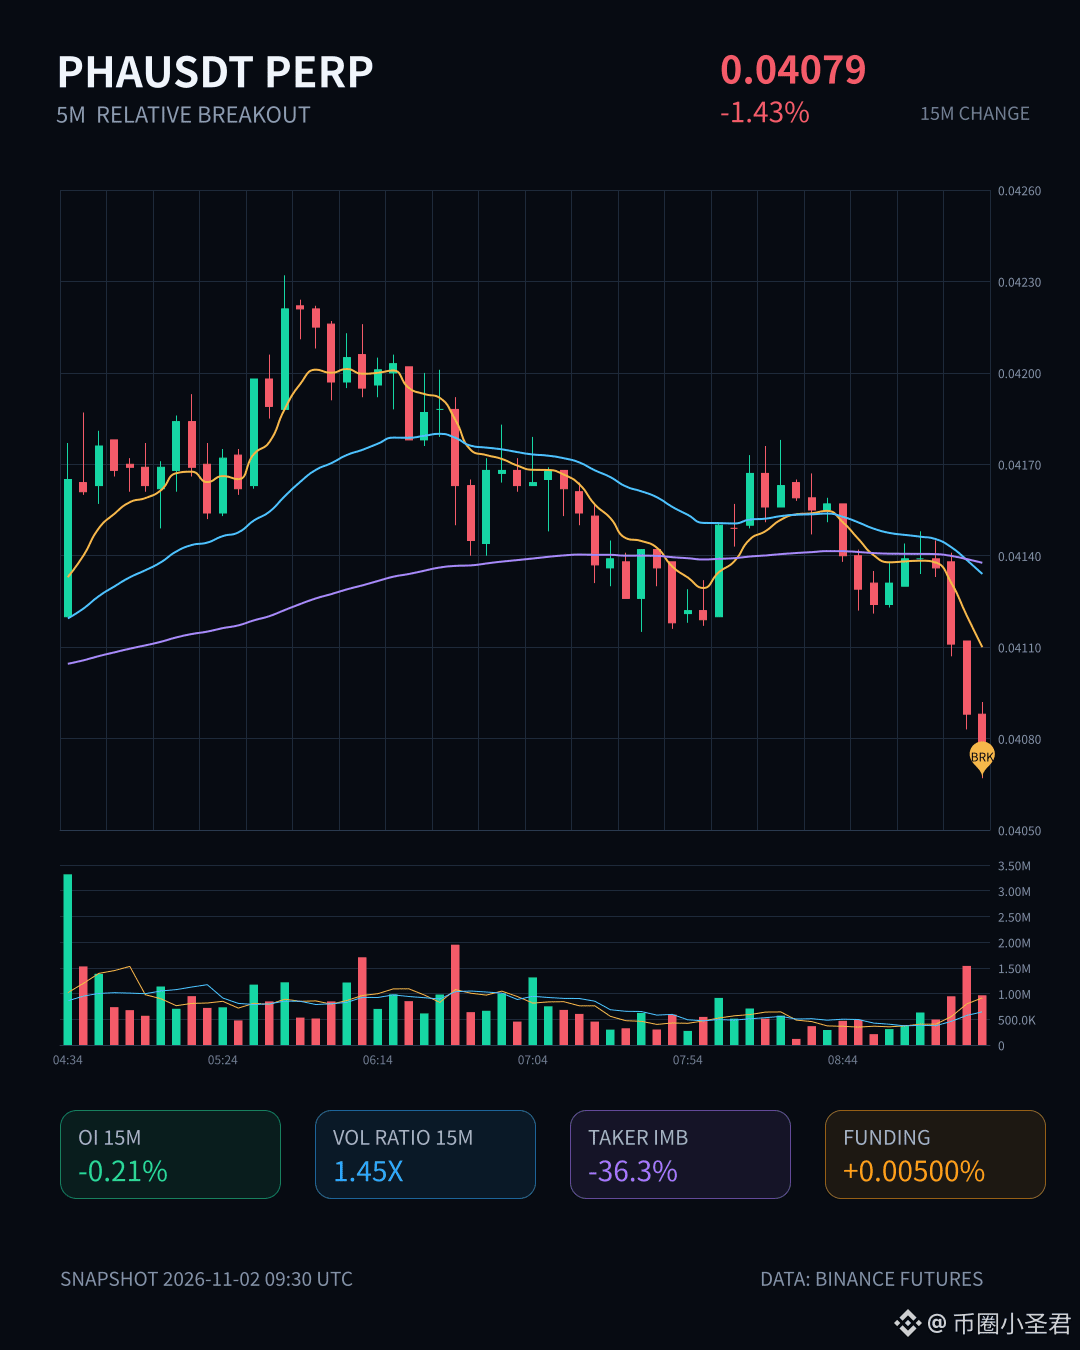
$PHA This 1.43% drop over 15m isn’t huge, but look at open interest—15m: -0.21%, 1h: -0.18%, with notional changes of -52K/-70K USDT. Price and OI are moving down together, a typical sign of longs deleveraging or stops being triggered—not shorts actively pushing the price down.
The taker trade imbalance is -36.3%, and the buy/sell ratio is 0.47, so selling pressure is indeed dominant. The close also broke below the lower bound of the last 20 5m candles, confirming weakness. But the OI anomaly percentile is 98.8%, ranked #2 across the entire pool—at this scale, against 6.55M USDT in 24h trading volume, liquidity is actually very thin. You could call it extreme, and you could also say it’s easy to sweep.
Keep watching whether the lower end of the range holds. A break below would mean acceleration; a recovery back above would mean a shakeout.
The taker trade imbalance is -36.3%, and the buy/sell ratio is 0.47, so selling pressure is indeed dominant. The close also broke below the lower bound of the last 20 5m candles, confirming weakness. But the OI anomaly percentile is 98.8%, ranked #2 across the entire pool—at this scale, against 6.55M USDT in 24h trading volume, liquidity is actually very thin. You could call it extreme, and you could also say it’s easy to sweep.
Keep watching whether the lower end of the range holds. A break below would mean acceleration; a recovery back above would mean a shakeout.