TRUMP Holds Above $1.60 After a Sharp Spike: Can Buyers Defend the Pullback?
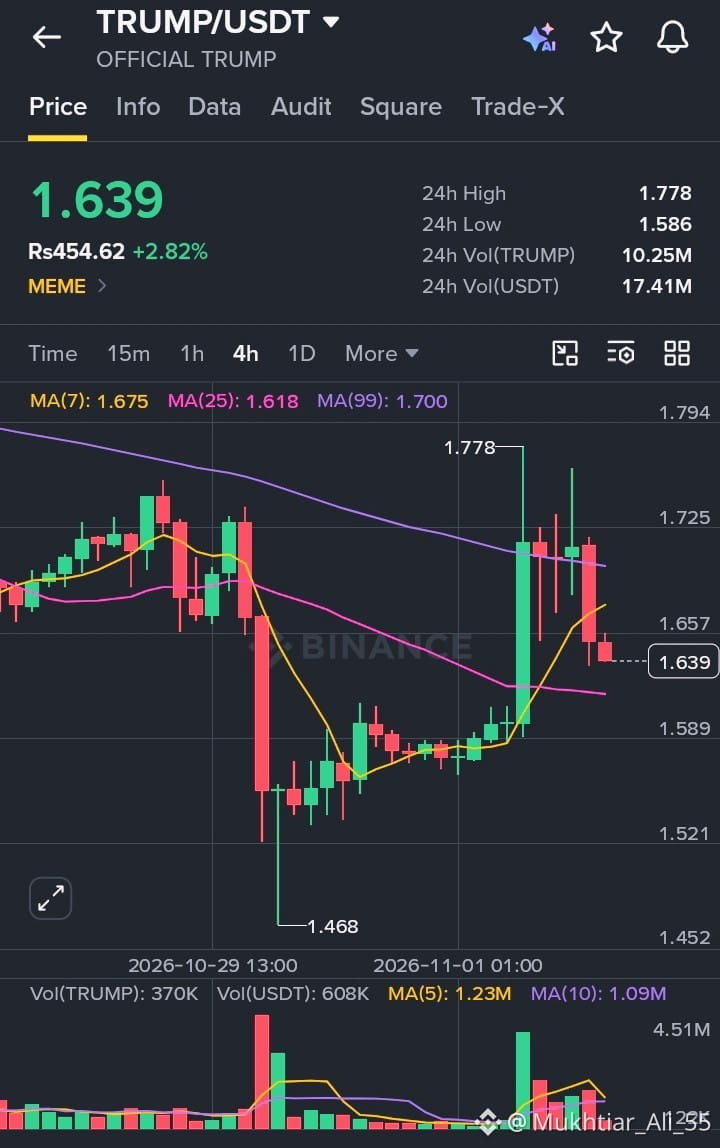
OFFICIAL TRUMP is trading at $1.639 on the 4H chart, up 2.82% on the day. After bottoming at $1.468, the token surged on a large green candle that tagged $1.778, then gave back part of the move with a run of red candles. This is the most volatile chart among the ones I’ve been tracking, which is typical for a meme asset.
Price structure: The 24h range sits between $1.586 and $1.778, a wide band that reflects the spike and the pullback that followed. The breakout candle cleared the earlier consolidation, but the upper wicks near $1.77 show sellers stepped in quickly. Price is now retracing toward the breakout base, and the question is whether that area holds as support.
Moving averages: Price sits between the averages. It is below the MA(7) at 1.675 and the MA(99) at 1.700, but still above the MA(25) at 1.618, which has turned upward and is the nearest support. The MA(99) is still sloping down overhead and rejected the last push, so the larger trend has not fully flipped.
Volume: 24h volume is about 10.25M TRUMP (roughly $17.41M). The breakout candle came with a clear volume surge, which gives the move some credibility. Volume has cooled on the pullback, though the red candles still show active selling that is worth watching.
What I’m watching:
Support: $1.618 where the MA(25) sits, then the $1.586 daily low and the $1.468 swing low
Resistance: $1.675 to $1.700, where the MA(7) and MA(99) sit, then the $1.778 daily high
A clean 4H close above $1.70 with rising volume would be the first sign that buyers have regained control. A break below $1.586 would signal the breakout has failed and put the lower range back in play.
#TRUMP #OfficialTrump #CryptoTrading #TechnicalAnalysis #TRUMPUSDT
$TRUMP
OFFICIAL TRUMP is trading at $1.639 on the 4H chart, up 2.82% on the day. After bottoming at $1.468, the token surged on a large green candle that tagged $1.778, then gave back part of the move with a run of red candles. This is the most volatile chart among the ones I’ve been tracking, which is typical for a meme asset.
Price structure: The 24h range sits between $1.586 and $1.778, a wide band that reflects the spike and the pullback that followed. The breakout candle cleared the earlier consolidation, but the upper wicks near $1.77 show sellers stepped in quickly. Price is now retracing toward the breakout base, and the question is whether that area holds as support.
Moving averages: Price sits between the averages. It is below the MA(7) at 1.675 and the MA(99) at 1.700, but still above the MA(25) at 1.618, which has turned upward and is the nearest support. The MA(99) is still sloping down overhead and rejected the last push, so the larger trend has not fully flipped.
Volume: 24h volume is about 10.25M TRUMP (roughly $17.41M). The breakout candle came with a clear volume surge, which gives the move some credibility. Volume has cooled on the pullback, though the red candles still show active selling that is worth watching.
What I’m watching:
Support: $1.618 where the MA(25) sits, then the $1.586 daily low and the $1.468 swing low
Resistance: $1.675 to $1.700, where the MA(7) and MA(99) sit, then the $1.778 daily high
A clean 4H close above $1.70 with rising volume would be the first sign that buyers have regained control. A break below $1.586 would signal the breakout has failed and put the lower range back in play.
#TRUMP #OfficialTrump #CryptoTrading #TechnicalAnalysis #TRUMPUSDT
$TRUMP