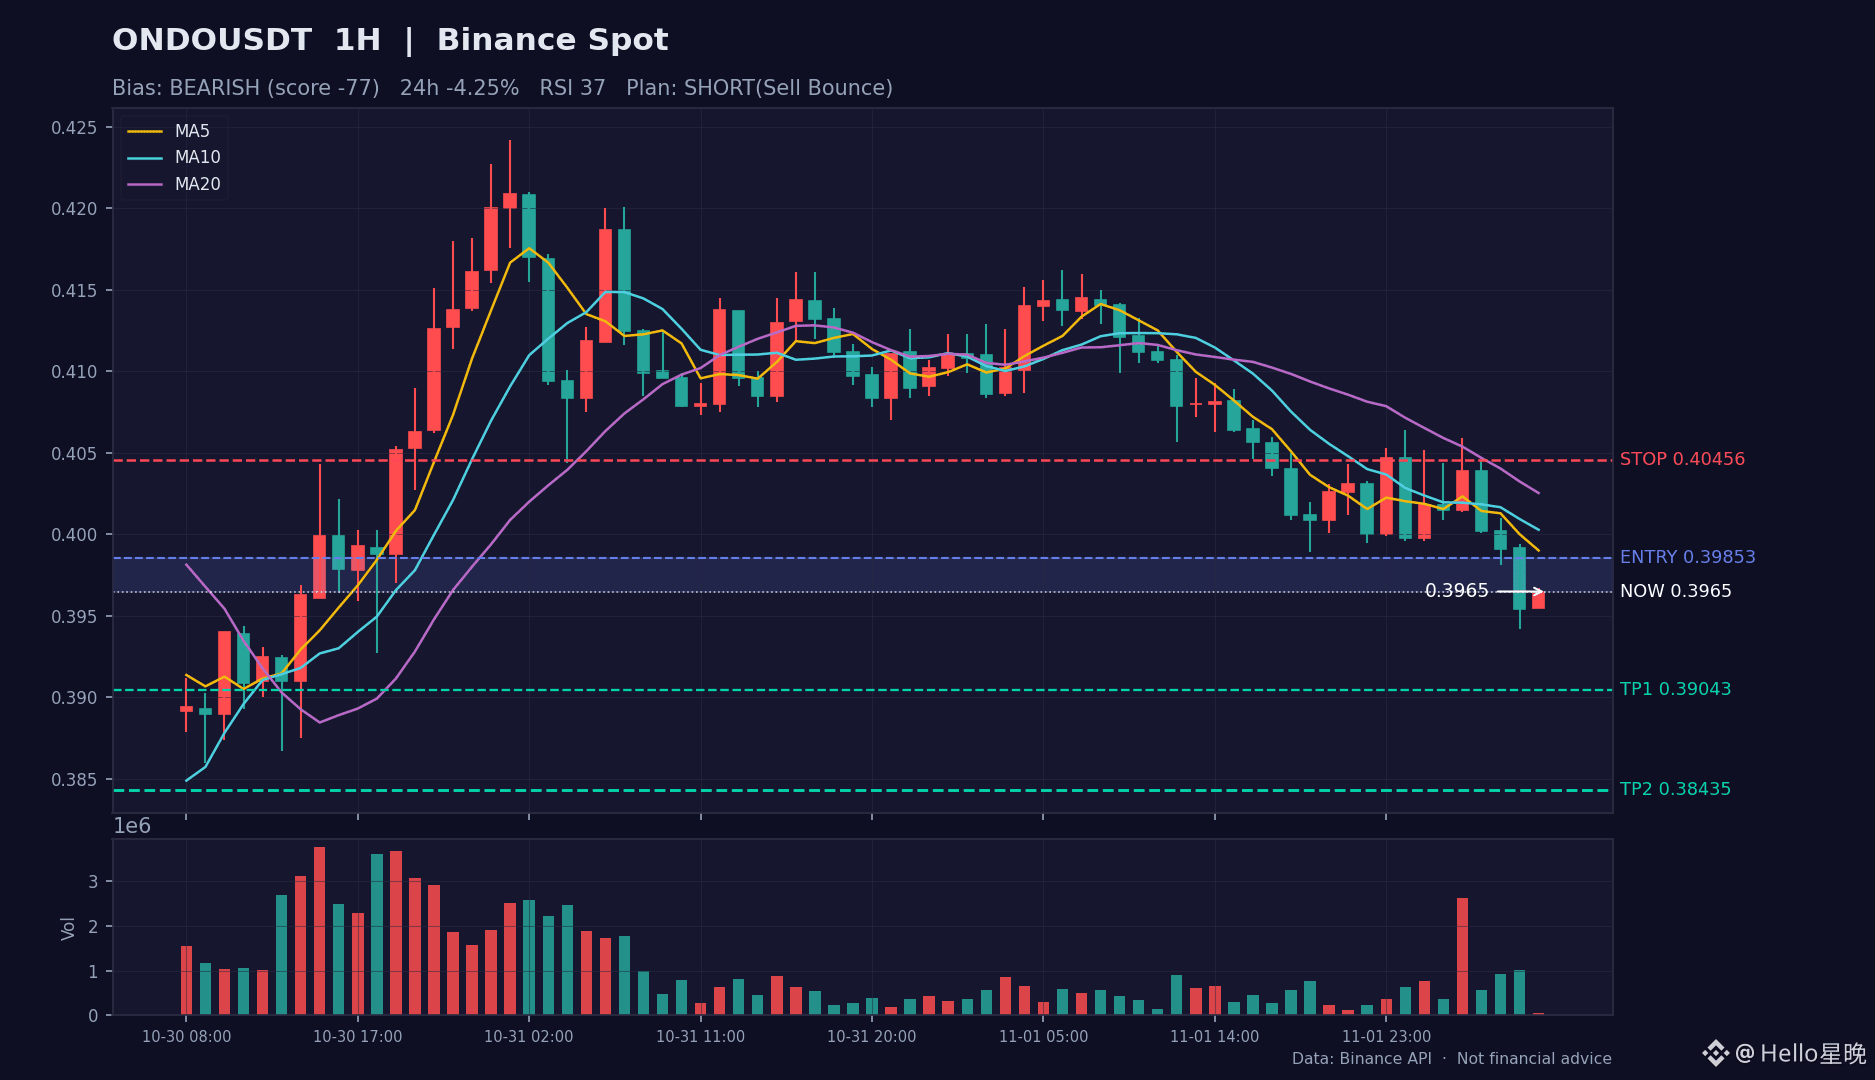
【System update: $ONDO sell signal triggered; entry zone/take-profit/stop-loss levels are marked on the chart】
【Signal source】
The 1H candlestick chart triggered a $ONDO sell signal at 11-02 14:00 (Beijing time, market closed) from the self-developed Quantitative Evolution System (Mutanabby_AI · 1-Hour Picks).
Overall score: **81 (S-grade)**, out of 100 = pattern 22 + structure 20 + momentum 19 + events 13 + liquidity 7; event factor: 🔥 featured on the hot list.
The signal has also been sent via WeCom. This is the chart-and-text review version, for convenient execution alongside the candlestick chart.
【Market overview】
$ONDO is currently at 0.39650, down 4.25% over 24 hours, with 24-hour trading volume of approximately 5.8M USDT.
【Technical analysis】
· Moving averages: MA5<MA10<MA20<MA60 in a bearish alignment; any rebound faces resistance from the moving averages
· Momentum: The MACD fast line is below the zero line, and the green bars have not disappeared; bearish momentum has not yet fully played out. RSI (37) is weak, and a rebound needs confirmation from increased volume
· Pattern: Price is tracking the lower Bollinger Band, with demand for an oversold bounce building up; volume has contracted (0.1 times the average), so directional signals should be treated with caution in this low-volume environment
【Signal and structure】
Overall score: -77/100. Directional assessment: bearish bias; signal direction: sell.
The technical picture aligns with the signal direction, so execution confidence is relatively high. Follow the planned levels and scale in at a normal pace.
【Trade plan reference】
· Strategy: Sell the rebound (in line with the signal direction)
· Entry zone: 0.39650 ~ 0.39853
· Take profit: First target 0.39043, second target 0.38435
· Stop loss: 0.40456
· Position size: Small position, 5%-10%; strictly exit if the stop-loss level is breached
· Chart: The candlestick analysis chart is attached to the post (1-hour chart, red for up and green for down; entry zone/take-profit/stop-loss levels are marked with colored lines)
【Risk warning】Small-cap coins are highly volatile, and event-driven moves can retrace quickly. Be sure to keep position sizes low.
The above is for personal review and technical record-keeping only and does not constitute investment advice. DYOR.
$ONDO #ONDO #量化交易 #Cryptocurrency
【Signal source】
The 1H candlestick chart triggered a $ONDO sell signal at 11-02 14:00 (Beijing time, market closed) from the self-developed Quantitative Evolution System (Mutanabby_AI · 1-Hour Picks).
Overall score: **81 (S-grade)**, out of 100 = pattern 22 + structure 20 + momentum 19 + events 13 + liquidity 7; event factor: 🔥 featured on the hot list.
The signal has also been sent via WeCom. This is the chart-and-text review version, for convenient execution alongside the candlestick chart.
【Market overview】
$ONDO is currently at 0.39650, down 4.25% over 24 hours, with 24-hour trading volume of approximately 5.8M USDT.
【Technical analysis】
· Moving averages: MA5<MA10<MA20<MA60 in a bearish alignment; any rebound faces resistance from the moving averages
· Momentum: The MACD fast line is below the zero line, and the green bars have not disappeared; bearish momentum has not yet fully played out. RSI (37) is weak, and a rebound needs confirmation from increased volume
· Pattern: Price is tracking the lower Bollinger Band, with demand for an oversold bounce building up; volume has contracted (0.1 times the average), so directional signals should be treated with caution in this low-volume environment
【Signal and structure】
Overall score: -77/100. Directional assessment: bearish bias; signal direction: sell.
The technical picture aligns with the signal direction, so execution confidence is relatively high. Follow the planned levels and scale in at a normal pace.
【Trade plan reference】
· Strategy: Sell the rebound (in line with the signal direction)
· Entry zone: 0.39650 ~ 0.39853
· Take profit: First target 0.39043, second target 0.38435
· Stop loss: 0.40456
· Position size: Small position, 5%-10%; strictly exit if the stop-loss level is breached
· Chart: The candlestick analysis chart is attached to the post (1-hour chart, red for up and green for down; entry zone/take-profit/stop-loss levels are marked with colored lines)
【Risk warning】Small-cap coins are highly volatile, and event-driven moves can retrace quickly. Be sure to keep position sizes low.
The above is for personal review and technical record-keeping only and does not constitute investment advice. DYOR.
$ONDO #ONDO #量化交易 #Cryptocurrency