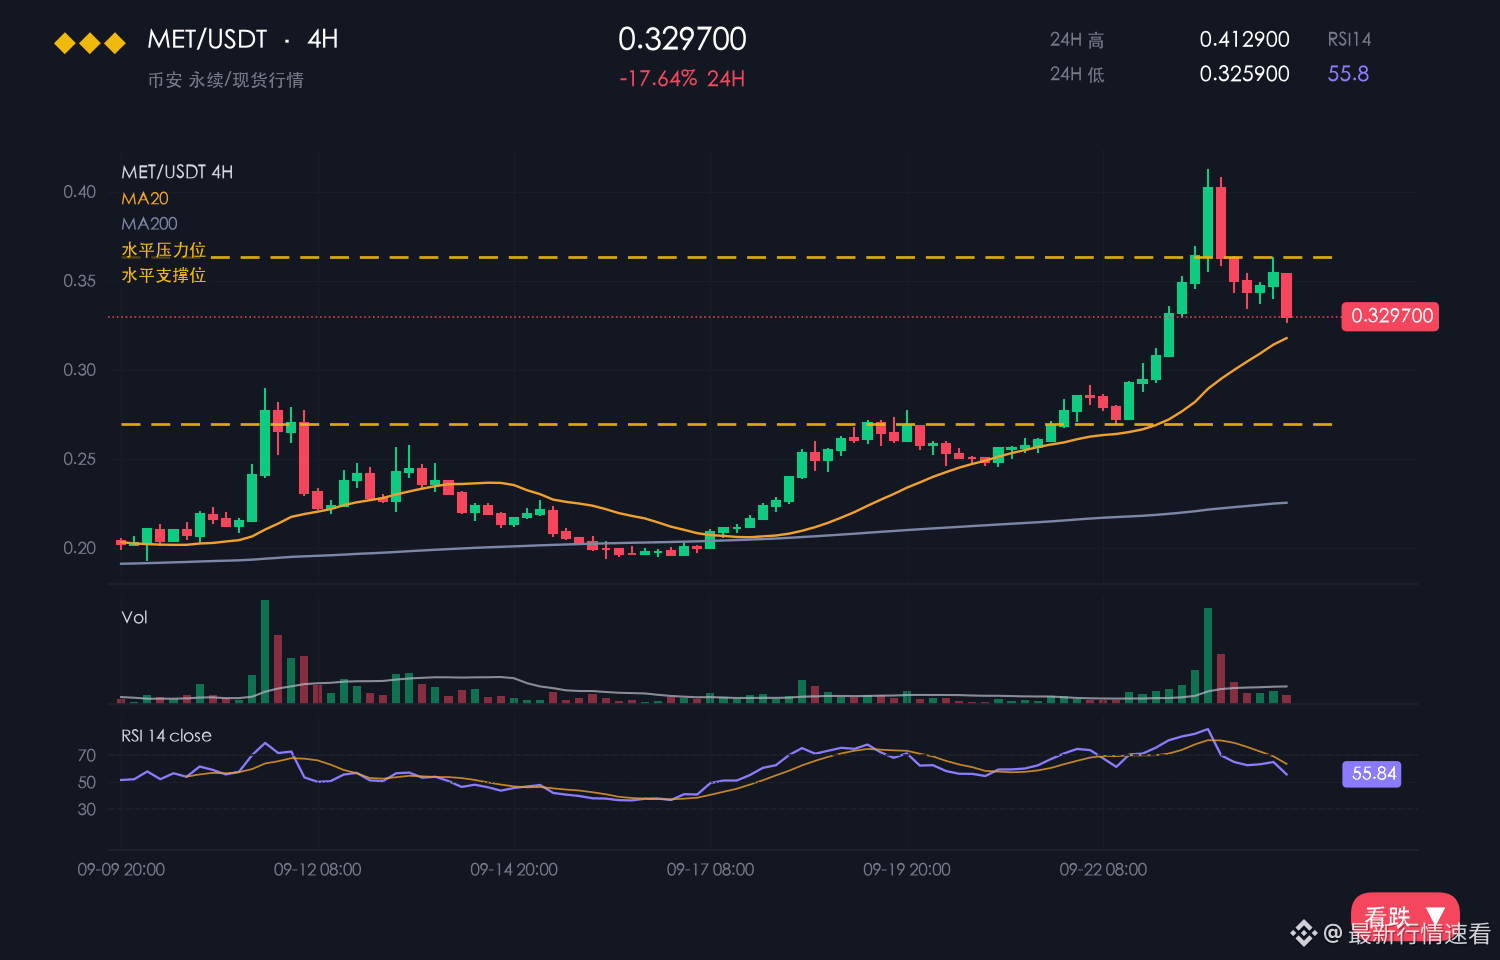
MET is currently at 0.3101, down 3.03% in 24 hours and still down 13.36% over 7 days. The intraday range is 0.3044–0.3240, with a 6.4% amplitude.
【Market】
At 0.3101, weakness is unmistakable.
Keep a close eye on 0.3044; if it breaks, watch 0.3240. If it wicks down and snaps back, accept the loss.
After falling 3.03% in 24 hours, MET failed to hold 0.3240, and its short-term trend is still moving lower.
The price is hovering around 0.3044; if this level gives way, the decline will accelerate.
Over the same period, BTC gained 0.31% in 24 hours, while MET's 3.03% drop significantly underperformed the broader market—funds are flowing out.
【Macro】 U.S. stocks rose overnight: Nasdaq +0.82%, S&P 500 +0.70% (2026-10-27 close). BTC ETFs have seen net outflows of around $45.2 billion this month, U.S. CPI came in above expectations at 3.7% year over year, and the probability of a rate hike at the 2026-10-27/28 policy meeting is about 47%. Spot BTC ETFs have seen net outflows of around $45.2 billion this month, as institutional buying has dried up.
The short-term outlook leans bearish.
【Bearish factors】
Just as I said, the tone changed in an instant—a 3.03% drop in half a day.
The 3.03% decline over 24 hours and 13.36% drop over 7 days are both heading downward, so short- and medium-term momentum are aligned.
Keep a close eye on key levels.
The risk is that a technical rebound could happen at any moment after the oversold decline, so it's important to have a backup plan, not just a directional view.
$MET #MET
【Market】
At 0.3101, weakness is unmistakable.
Keep a close eye on 0.3044; if it breaks, watch 0.3240. If it wicks down and snaps back, accept the loss.
After falling 3.03% in 24 hours, MET failed to hold 0.3240, and its short-term trend is still moving lower.
The price is hovering around 0.3044; if this level gives way, the decline will accelerate.
Over the same period, BTC gained 0.31% in 24 hours, while MET's 3.03% drop significantly underperformed the broader market—funds are flowing out.
【Macro】 U.S. stocks rose overnight: Nasdaq +0.82%, S&P 500 +0.70% (2026-10-27 close). BTC ETFs have seen net outflows of around $45.2 billion this month, U.S. CPI came in above expectations at 3.7% year over year, and the probability of a rate hike at the 2026-10-27/28 policy meeting is about 47%. Spot BTC ETFs have seen net outflows of around $45.2 billion this month, as institutional buying has dried up.
The short-term outlook leans bearish.
【Bearish factors】
Just as I said, the tone changed in an instant—a 3.03% drop in half a day.
The 3.03% decline over 24 hours and 13.36% drop over 7 days are both heading downward, so short- and medium-term momentum are aligned.
Keep a close eye on key levels.
The risk is that a technical rebound could happen at any moment after the oversold decline, so it's important to have a backup plan, not just a directional view.
$MET #MET