#BTC Weekly Report (Week 1 of November)
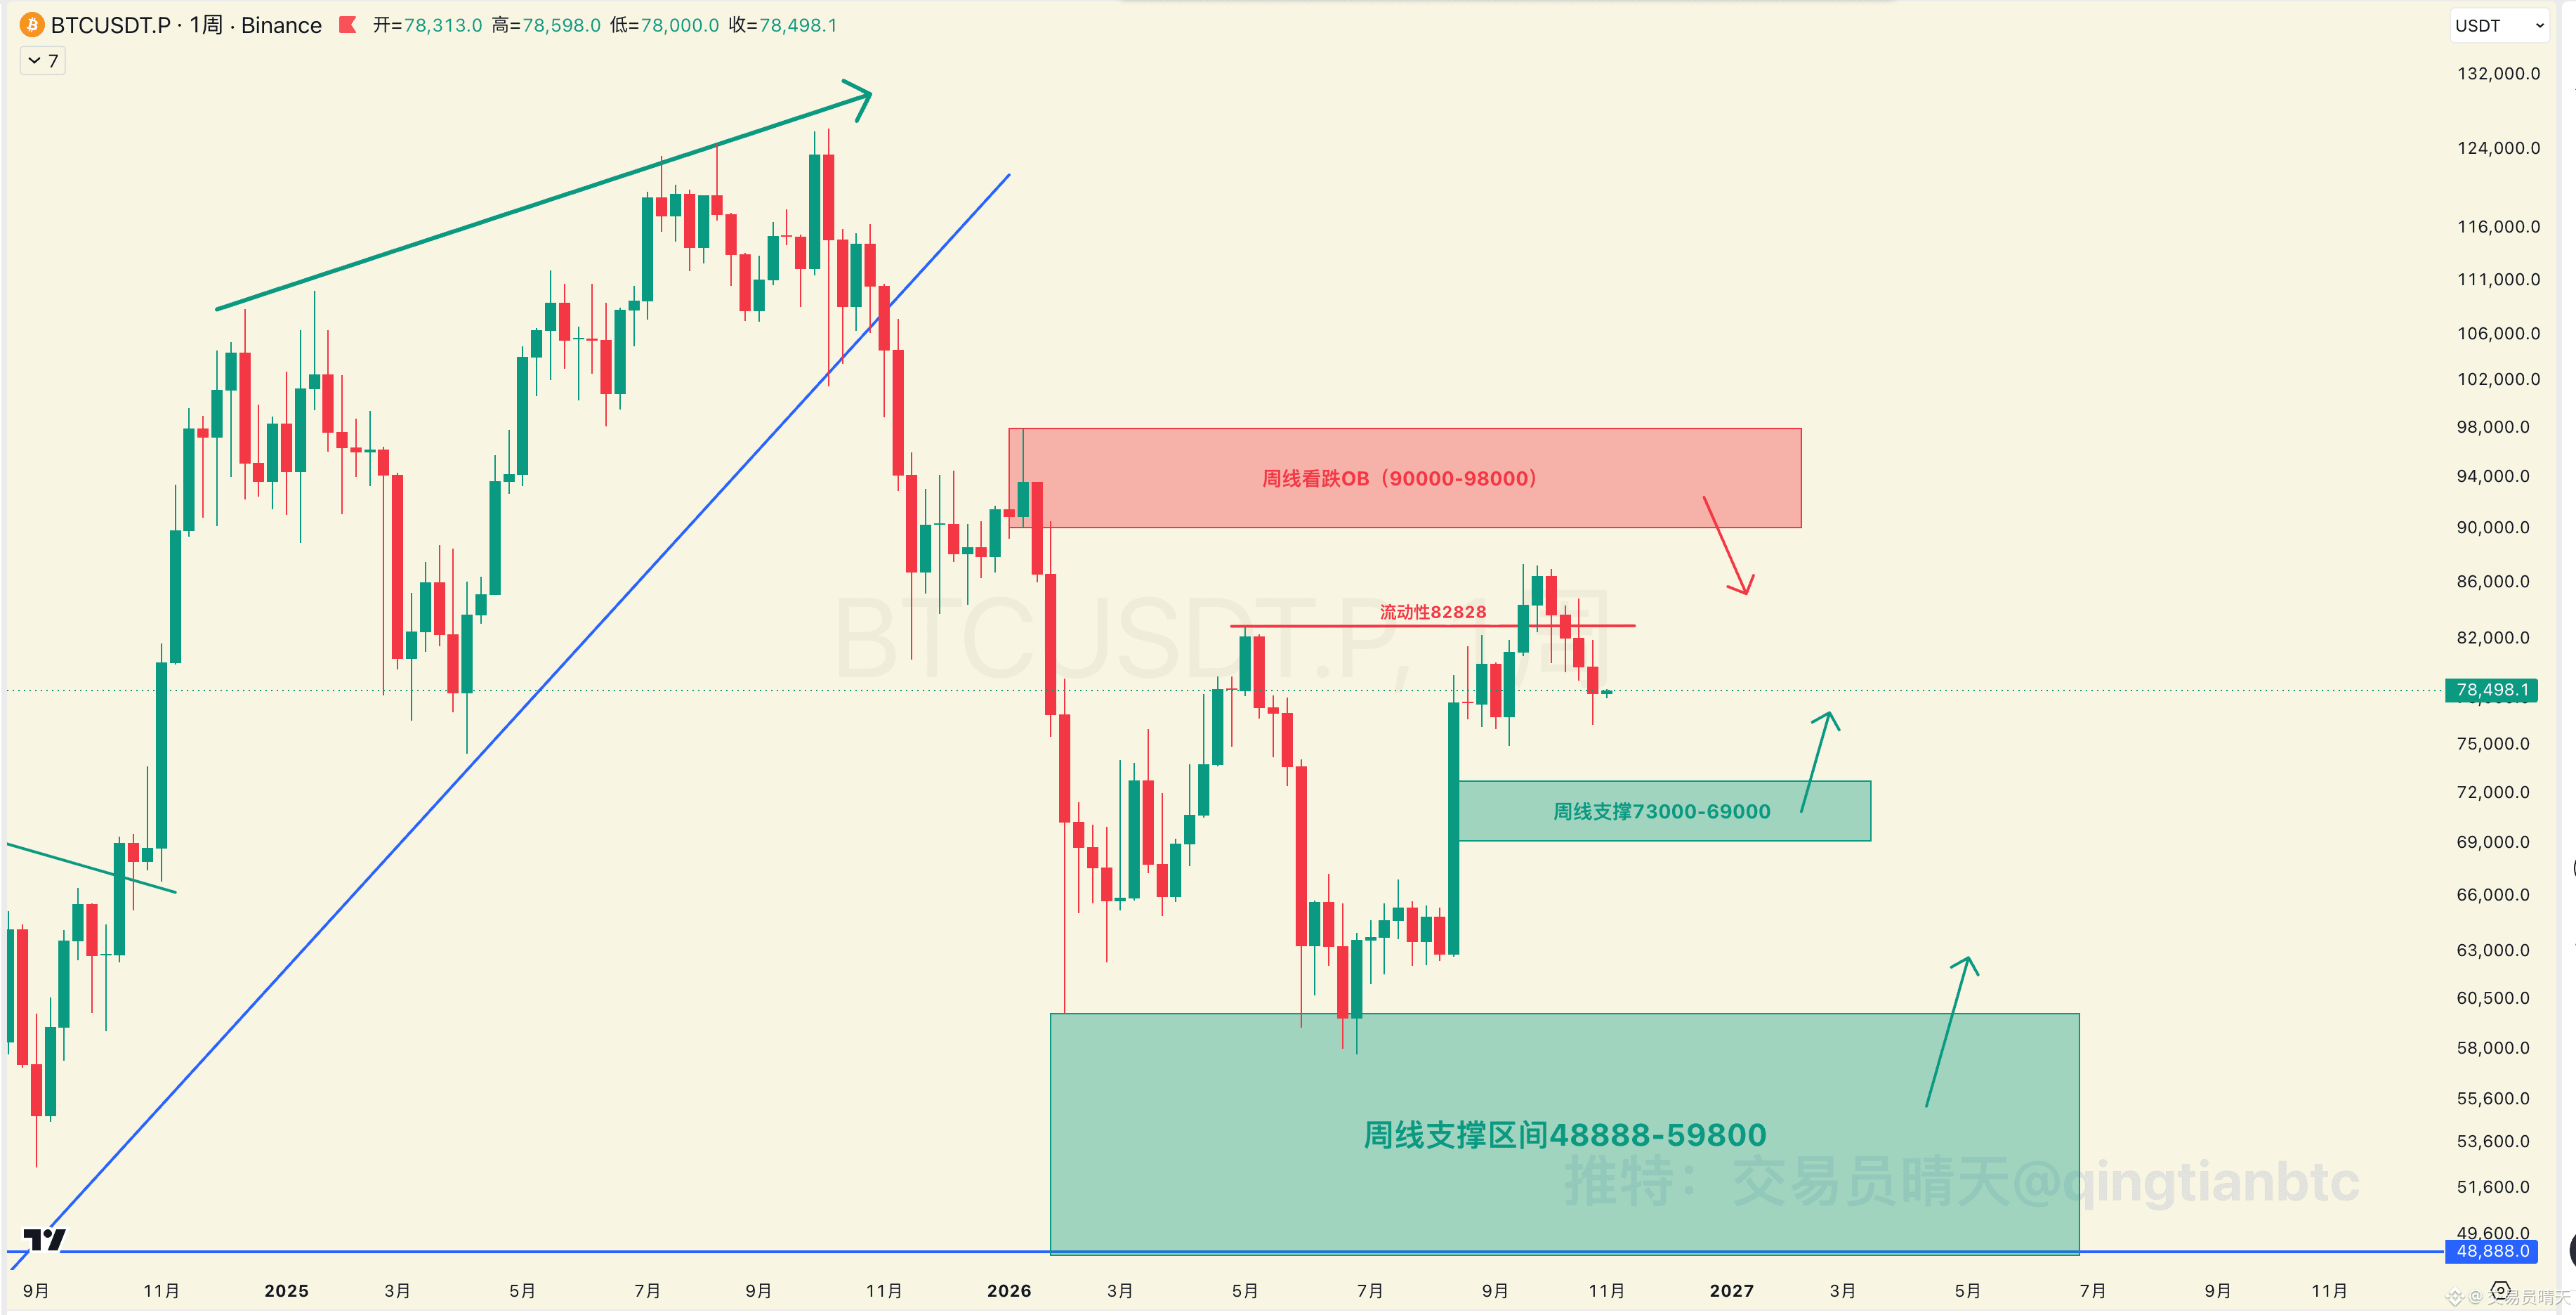
【Weekly Chart】
1) The weekly chart has fallen $10,000 from its high and has closed bearish for four consecutive weeks, so I’m not as bearish this week and am leaning more toward a rebound or sideways movement.
2) Weekly support is at 73,000–69,000. This is a long-term long-entry zone, so you must go long when price reaches it.
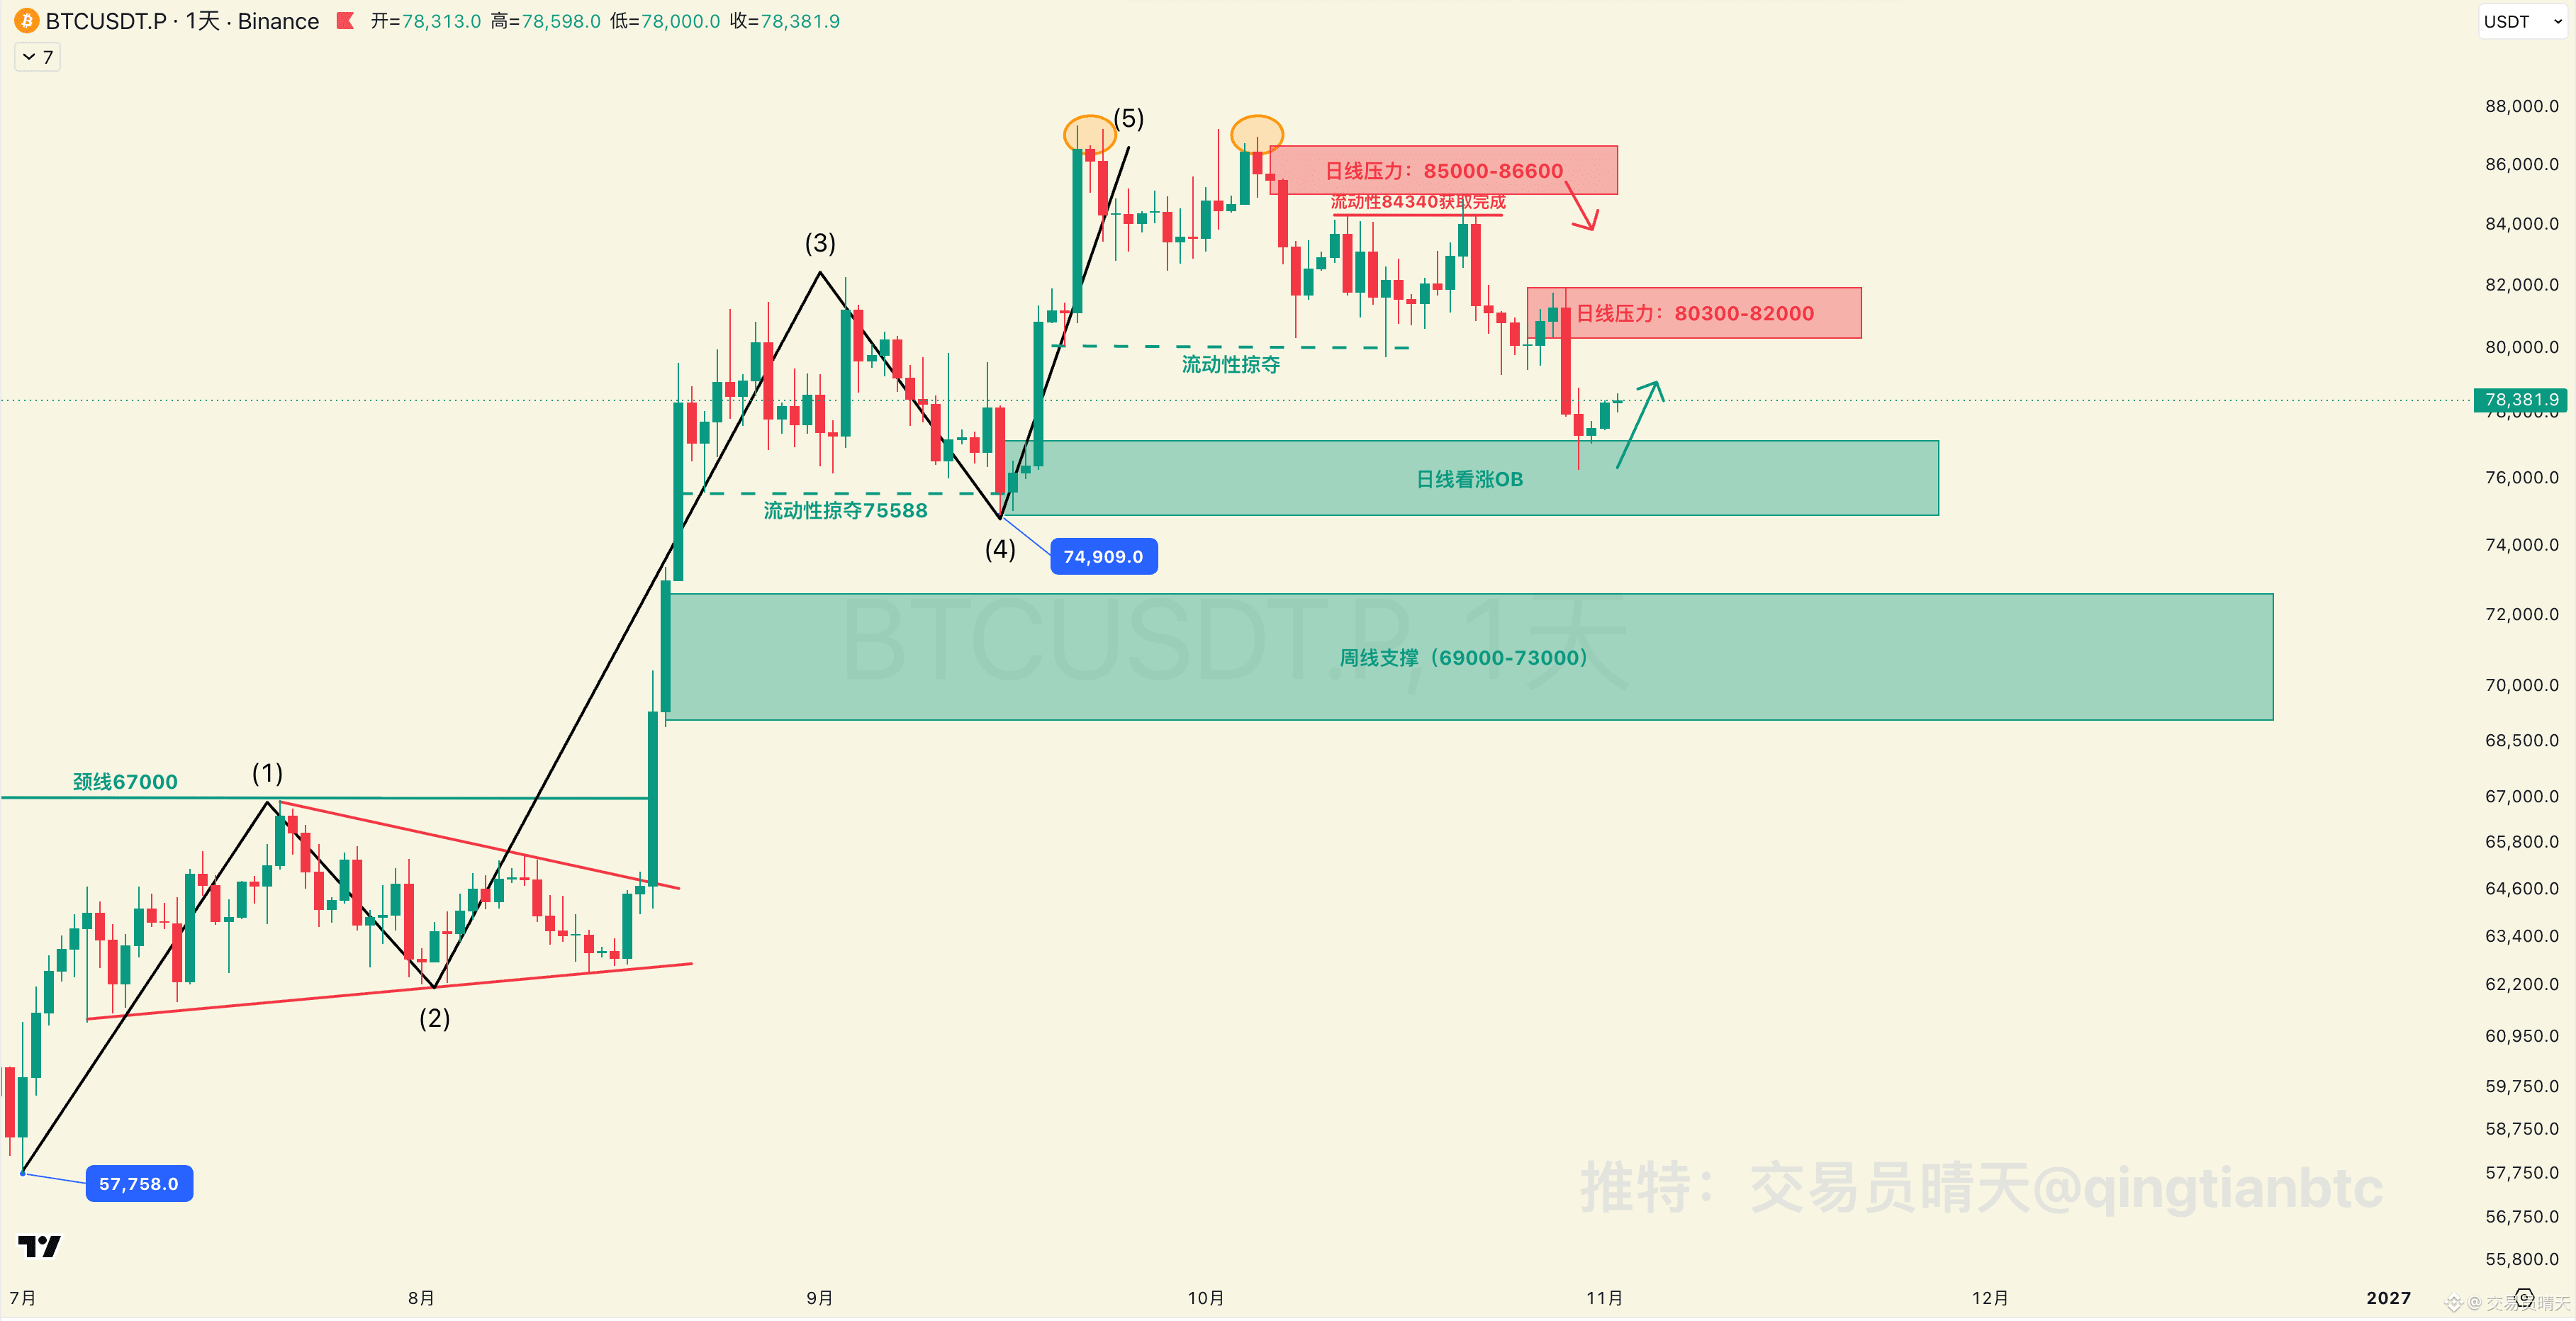
【Daily Chart】
The double-top target of 77,500 has been reached ✅ (called it a month ago)
1) Daily bullish OB: the long position at 77,100–74,800 is already in; now waiting for a rebound.
2) The daily resistance is also a bearish OB zone, at 80,300–82,000.
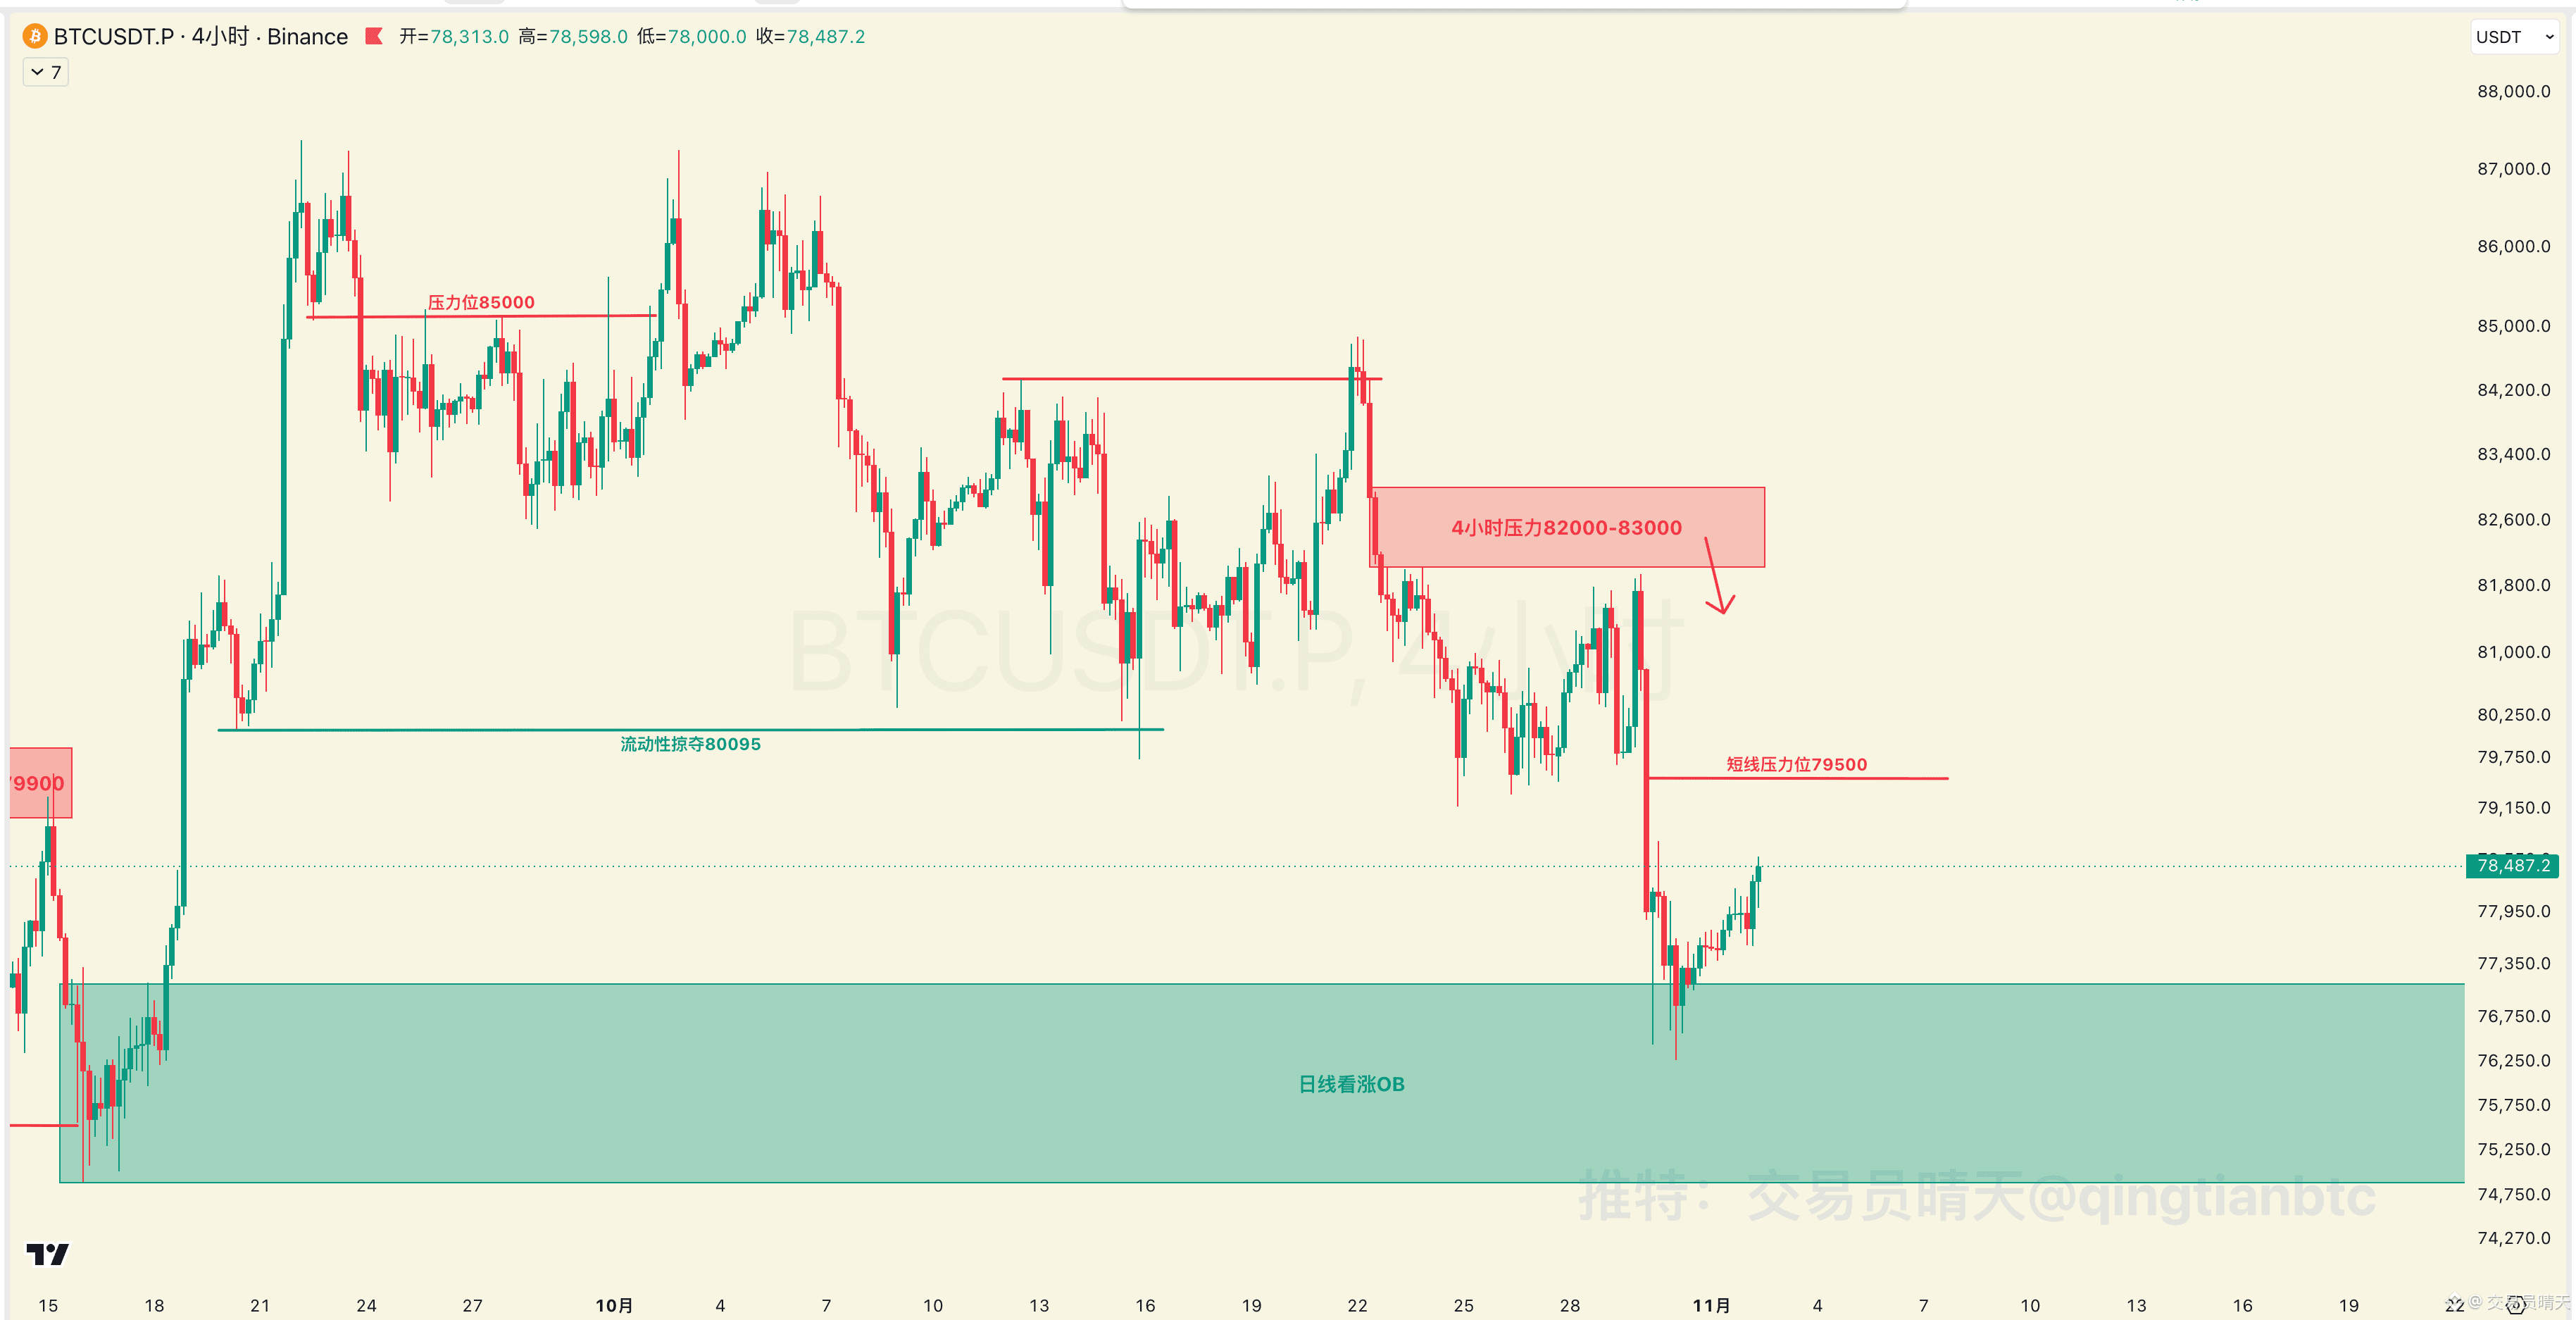
【4-Hour Chart】
Last week, when price fell to 76,500, I reminded you that the swing short was over—don’t foolishly chase the drop. Daily support is an opportunity to go long. Price has now rebounded to 78,500, up around $2,000. Keep an eye on short-term resistance at 79,500.
【Weekly Chart】
1) The weekly chart has fallen $10,000 from its high and has closed bearish for four consecutive weeks, so I’m not as bearish this week and am leaning more toward a rebound or sideways movement.
2) Weekly support is at 73,000–69,000. This is a long-term long-entry zone, so you must go long when price reaches it.
【Daily Chart】
The double-top target of 77,500 has been reached ✅ (called it a month ago)
1) Daily bullish OB: the long position at 77,100–74,800 is already in; now waiting for a rebound.
2) The daily resistance is also a bearish OB zone, at 80,300–82,000.
【4-Hour Chart】
Last week, when price fell to 76,500, I reminded you that the swing short was over—don’t foolishly chase the drop. Daily support is an opportunity to go long. Price has now rebounded to 78,500, up around $2,000. Keep an eye on short-term resistance at 79,500.