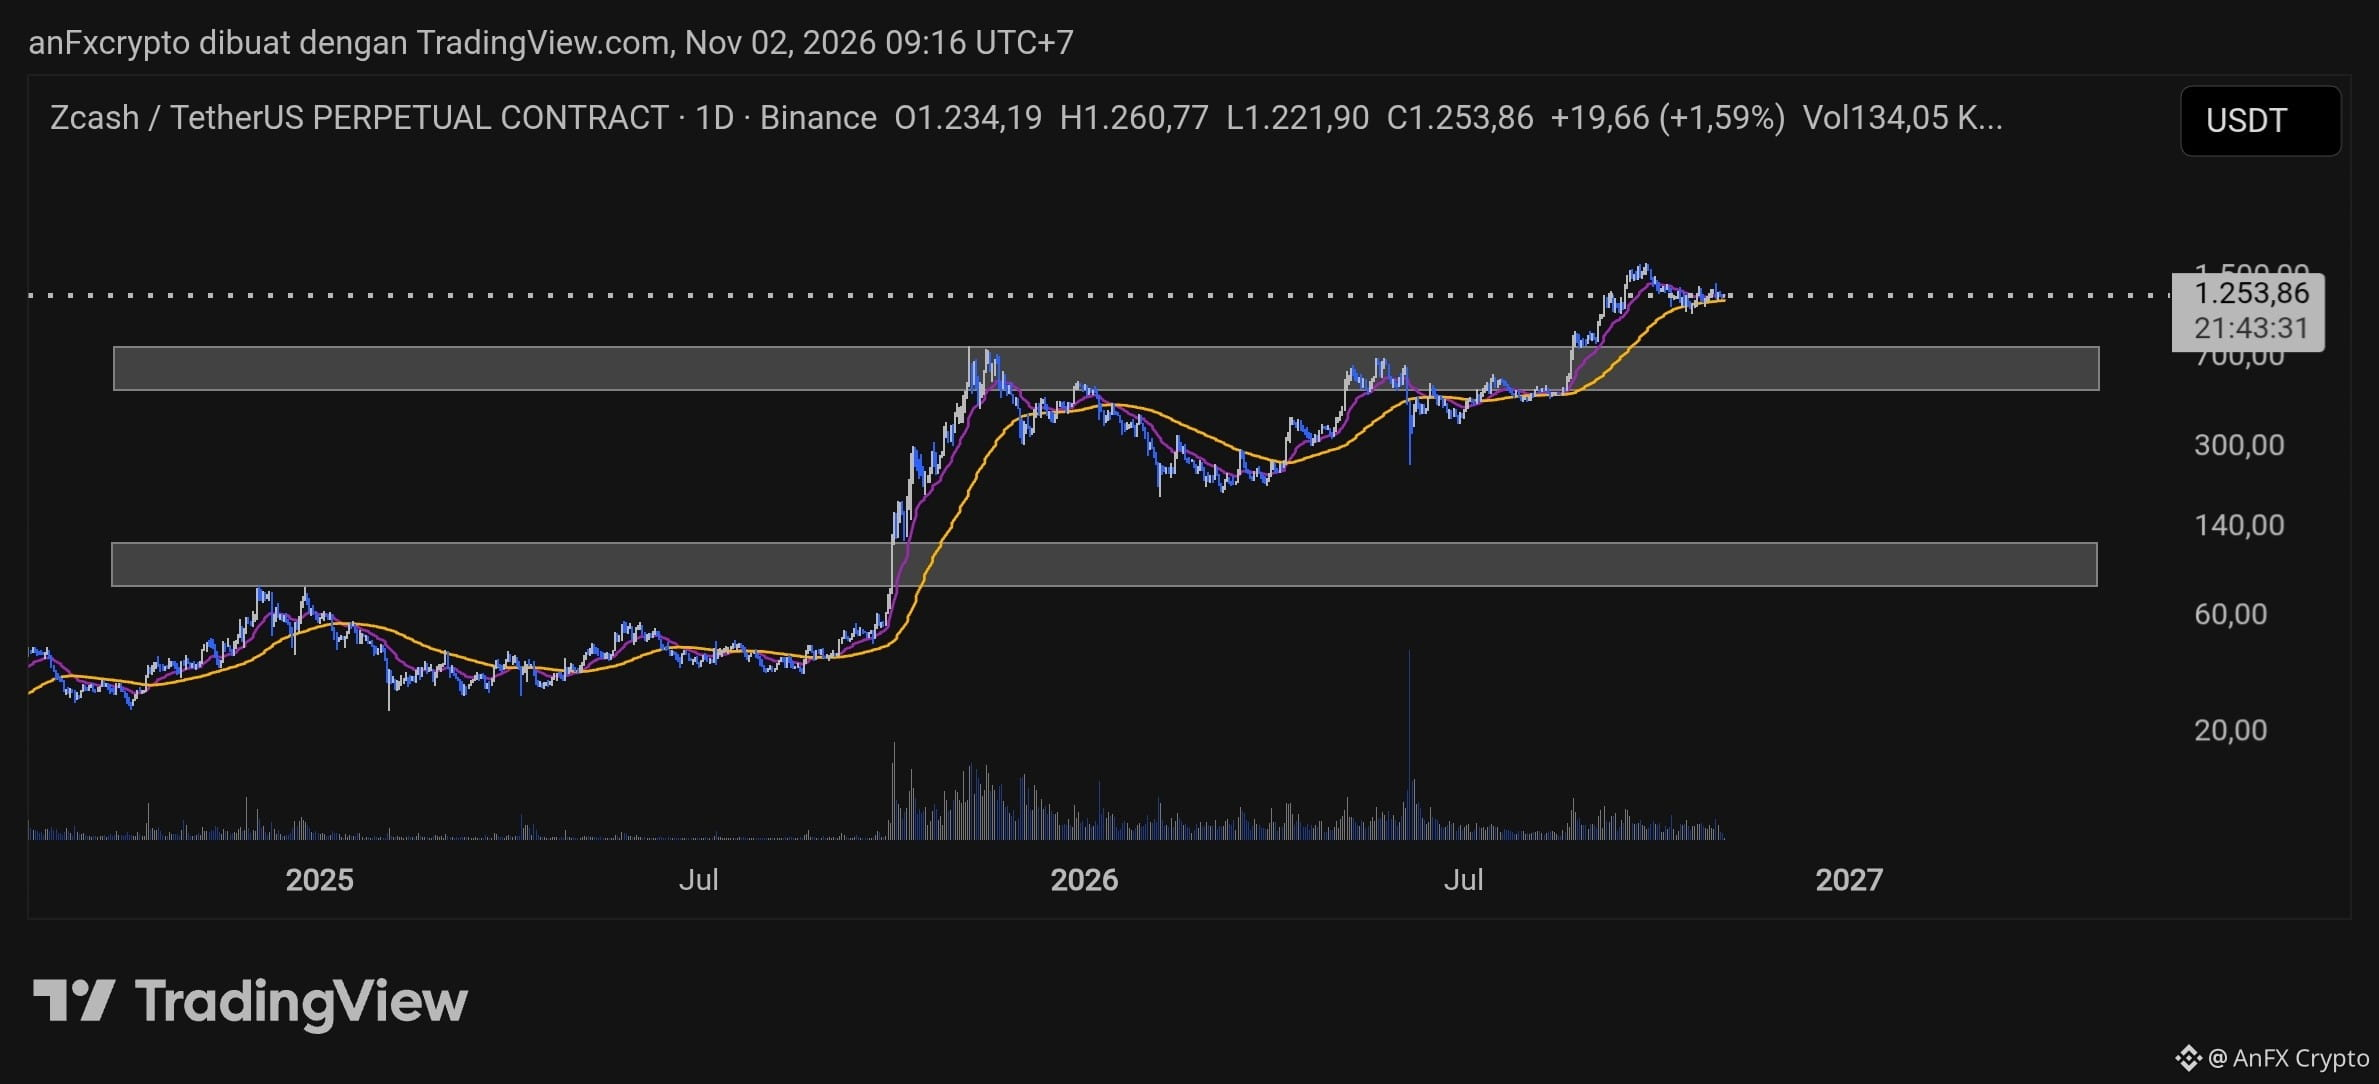
Technical Analysis $ZEC /USDT (Timeframe 1D):
Trend Structure: Price action indicates a continued macro bullish trend, with a test of the upper resistance area around $1.250–$1.500.
Moving Average Indicator: The price is above the main MA indicator lines, showing strong buyer dominance in the medium term.
Reaction Zone: A tight resistance area lies at $1.250–$1.280. Rejection in this zone could trigger short-term consolidation before the uptrend resumes.
Trading Signals (Futures / Perpetual):
Action: Buy on Dip or Breakout Long
Entry Area: $1.210 – $1.240
Take Profit (TP):
TP1: $1.350
TP2: $1.450
TP3: $1.500
Stop Loss (SL): Below $1.150 (Maximum risk management: 2–3% of total capital).
Trend Structure: Price action indicates a continued macro bullish trend, with a test of the upper resistance area around $1.250–$1.500.
Moving Average Indicator: The price is above the main MA indicator lines, showing strong buyer dominance in the medium term.
Reaction Zone: A tight resistance area lies at $1.250–$1.280. Rejection in this zone could trigger short-term consolidation before the uptrend resumes.
Trading Signals (Futures / Perpetual):
Action: Buy on Dip or Breakout Long
Entry Area: $1.210 – $1.240
Take Profit (TP):
TP1: $1.350
TP2: $1.450
TP3: $1.500
Stop Loss (SL): Below $1.150 (Maximum risk management: 2–3% of total capital).