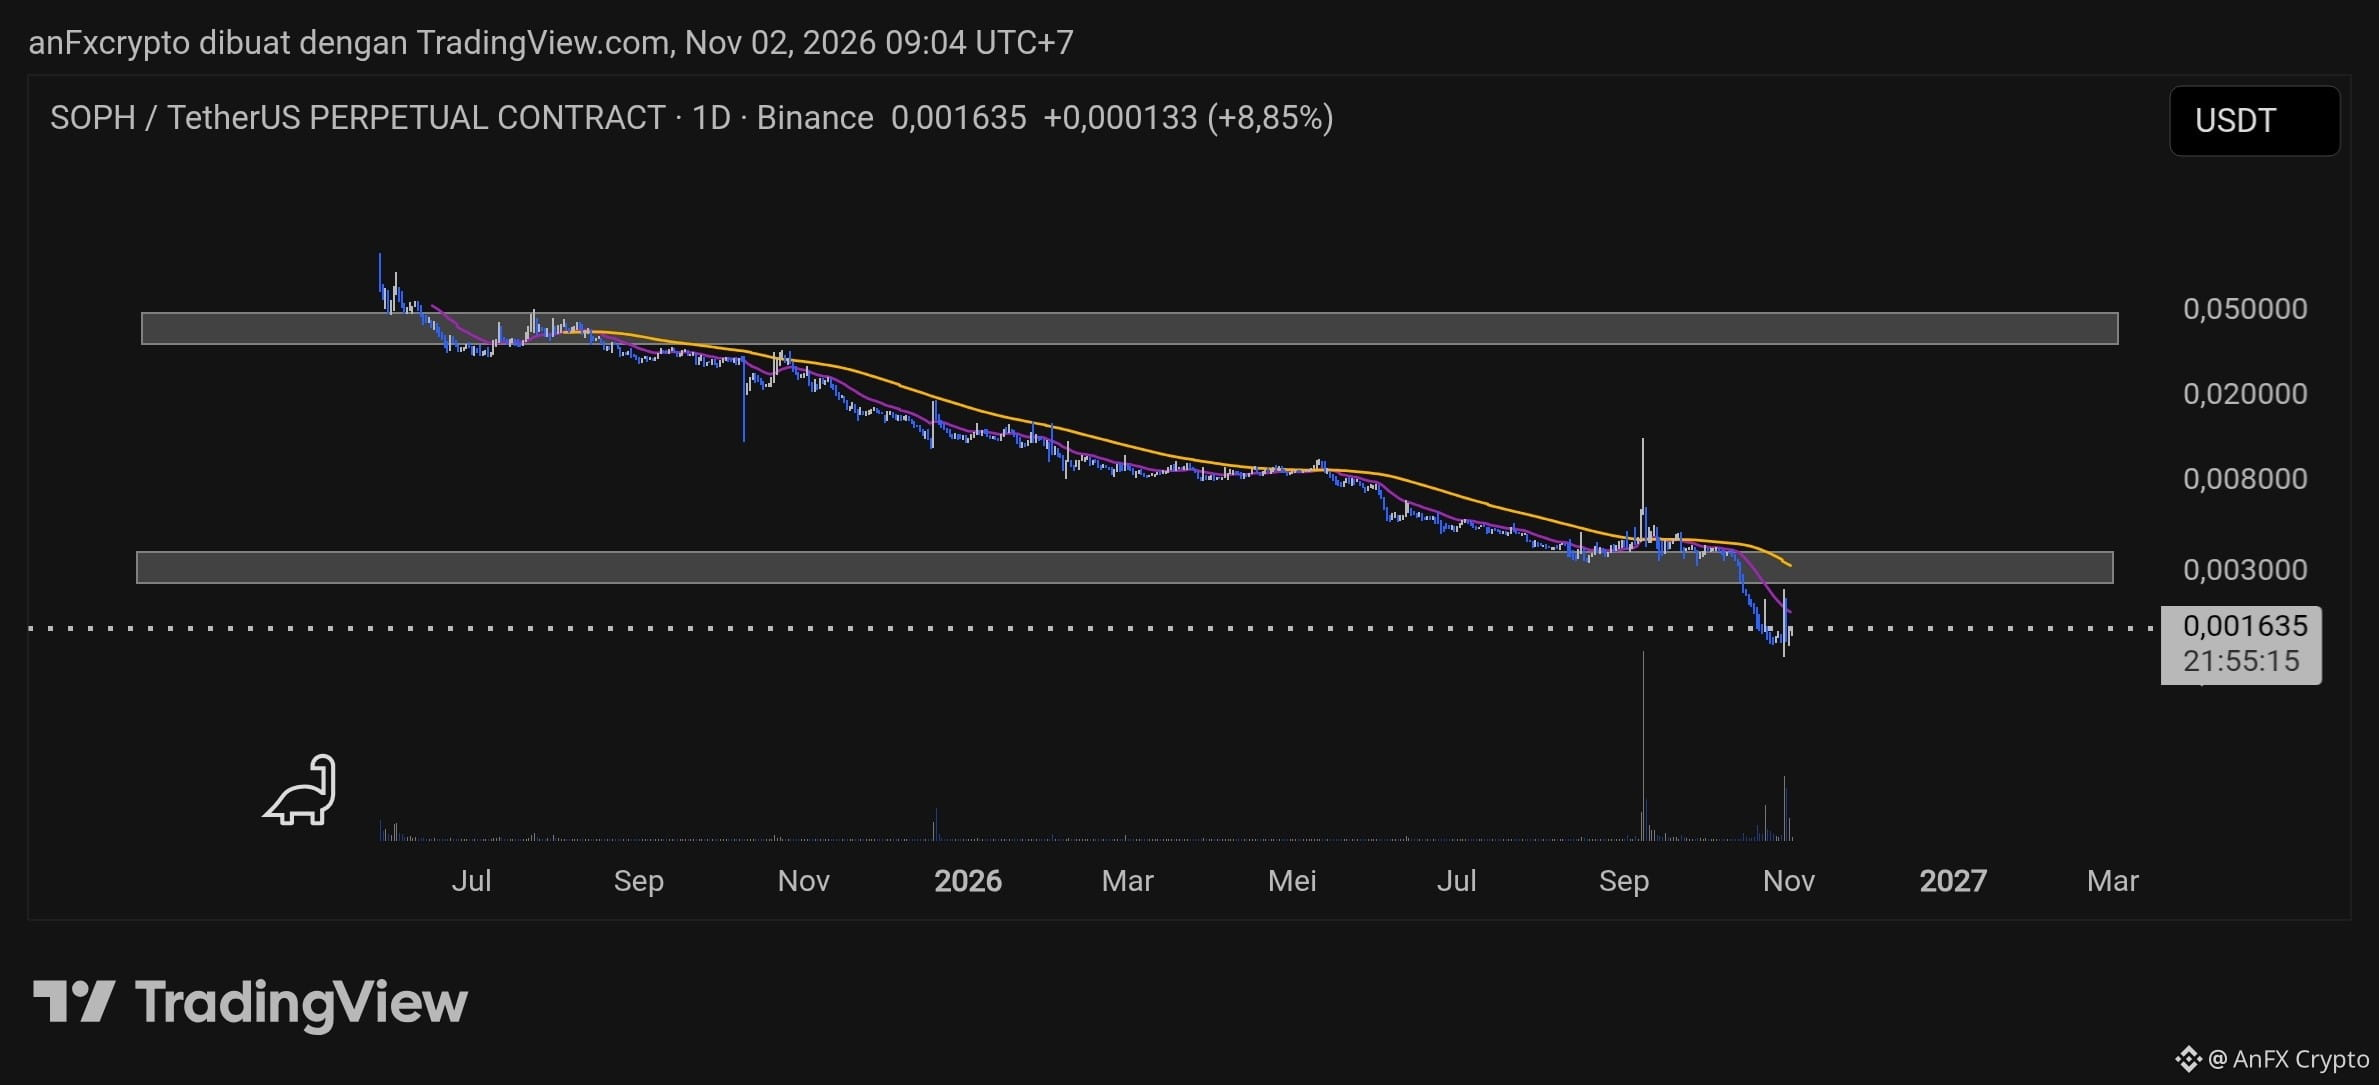
Technical Analysis $SOPH /USDT (1D):
Trend Structure: Strong long-term bearish trend with consecutive lower lows. The chart shows a breakdown below the key support zone at 0,00300 USDT.
Moving Average Indicator: The price is well below the MA/EMA trend lines, indicating dominant selling pressure.
Trading Signals:
Direction: Short (Follow the main downtrend).
Entry: 0,00138 – 0,00142 USDT.
Take Profit (TP): 0,00120 USDT / 0,00110 USDT.
Stop Loss (SL): 0,00155 USDT.
Trend Structure: Strong long-term bearish trend with consecutive lower lows. The chart shows a breakdown below the key support zone at 0,00300 USDT.
Moving Average Indicator: The price is well below the MA/EMA trend lines, indicating dominant selling pressure.
Trading Signals:
Direction: Short (Follow the main downtrend).
Entry: 0,00138 – 0,00142 USDT.
Take Profit (TP): 0,00120 USDT / 0,00110 USDT.
Stop Loss (SL): 0,00155 USDT.