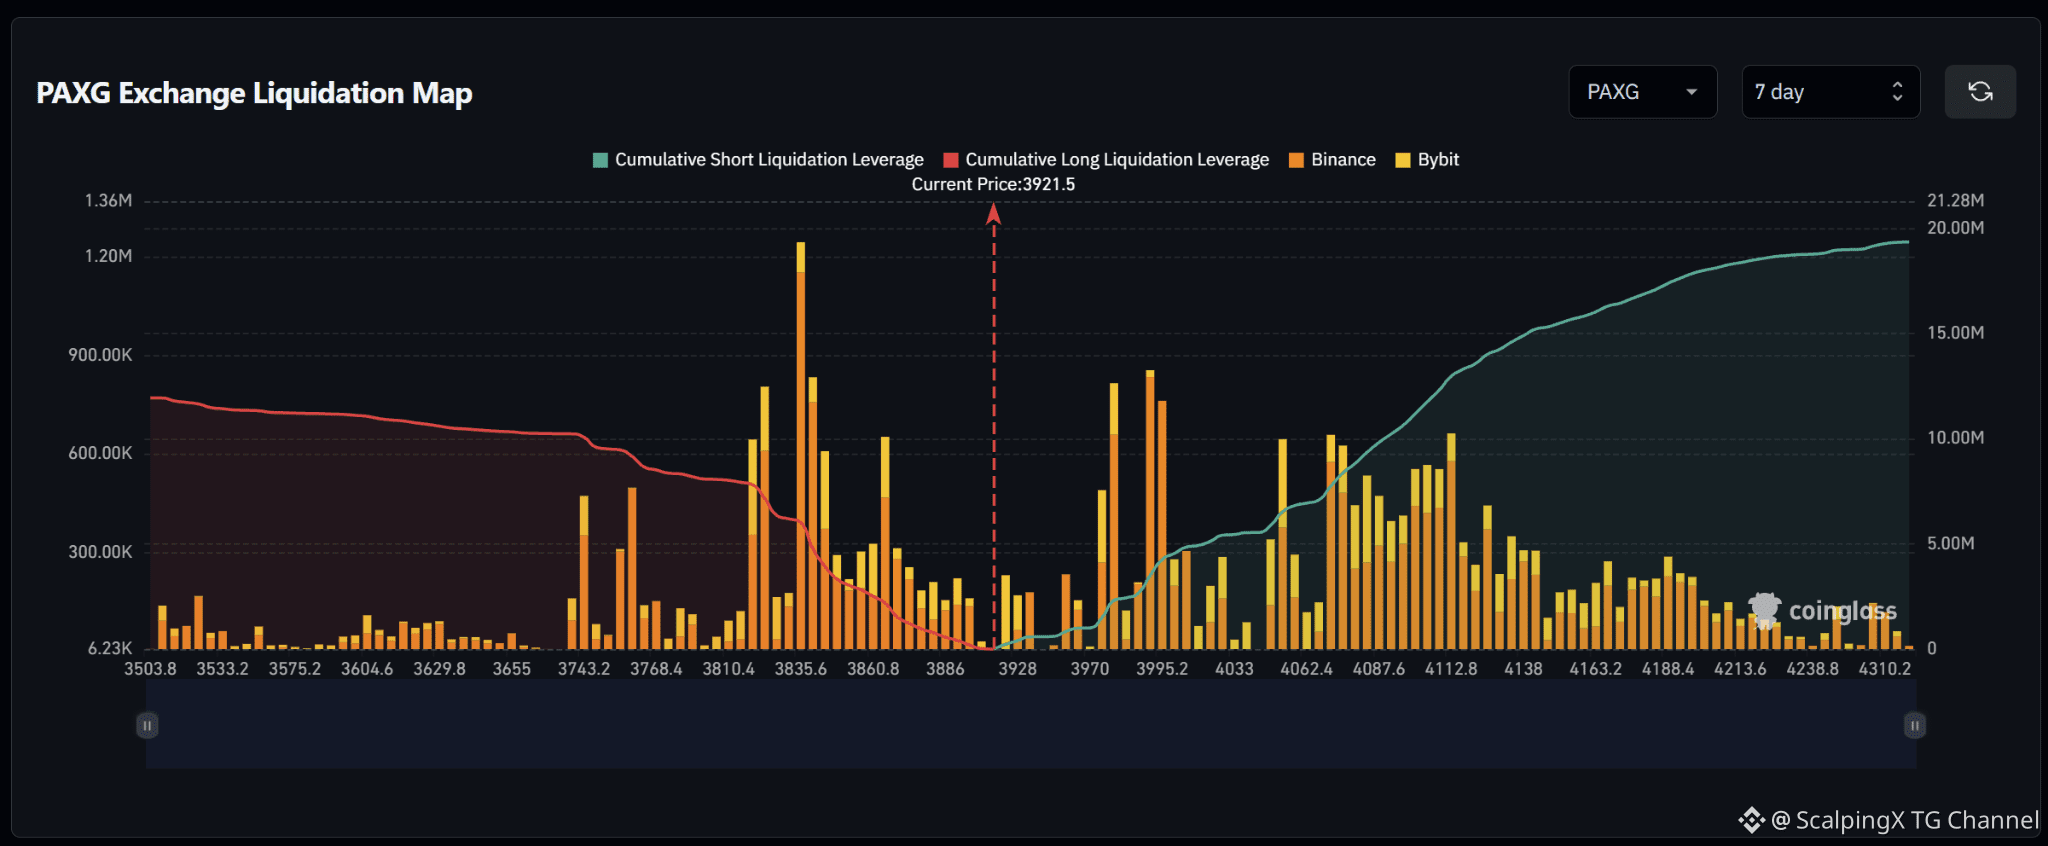
$PAXG – Liquidation Map (7 days) – Index ~3,921.5
🧭 The preferred scenario is an upside short sweep. Prominent short clusters sit around 3,975–4,000, followed by a broader band at 4,050–4,115. Estimated cumulative short liquidation exposure also exceeds the long side across the displayed range.
🔺 A break and hold above 3,950 brings 3,975–4,000 into focus. Short liquidations there could amplify the advance; the reaction after the sweep will help assess continuation.
🎯 Holding above 4,000 would bring clusters at 4,050–4,070 and 4,080–4,115 into focus next. Liquidation bars are more scattered between 4,010 and 4,045, making price retention after the initial sweep important.
⚖️ Losing 3,900 without a reclaim would weaken the upside scenario and shift attention to long clusters at 3,860–3,890, then 3,815–3,845. The map’s largest liquidation bar sits near 3,835. Avoid chasing a short sweep that quickly reverses below 3,950.
#LiquidationMap
🧭 The preferred scenario is an upside short sweep. Prominent short clusters sit around 3,975–4,000, followed by a broader band at 4,050–4,115. Estimated cumulative short liquidation exposure also exceeds the long side across the displayed range.
🔺 A break and hold above 3,950 brings 3,975–4,000 into focus. Short liquidations there could amplify the advance; the reaction after the sweep will help assess continuation.
🎯 Holding above 4,000 would bring clusters at 4,050–4,070 and 4,080–4,115 into focus next. Liquidation bars are more scattered between 4,010 and 4,045, making price retention after the initial sweep important.
⚖️ Losing 3,900 without a reclaim would weaken the upside scenario and shift attention to long clusters at 3,860–3,890, then 3,815–3,845. The map’s largest liquidation bar sits near 3,835. Avoid chasing a short sweep that quickly reverses below 3,950.
#LiquidationMap