The First Decent Sign of a Bottom? | Weekly Review 2026-11-2
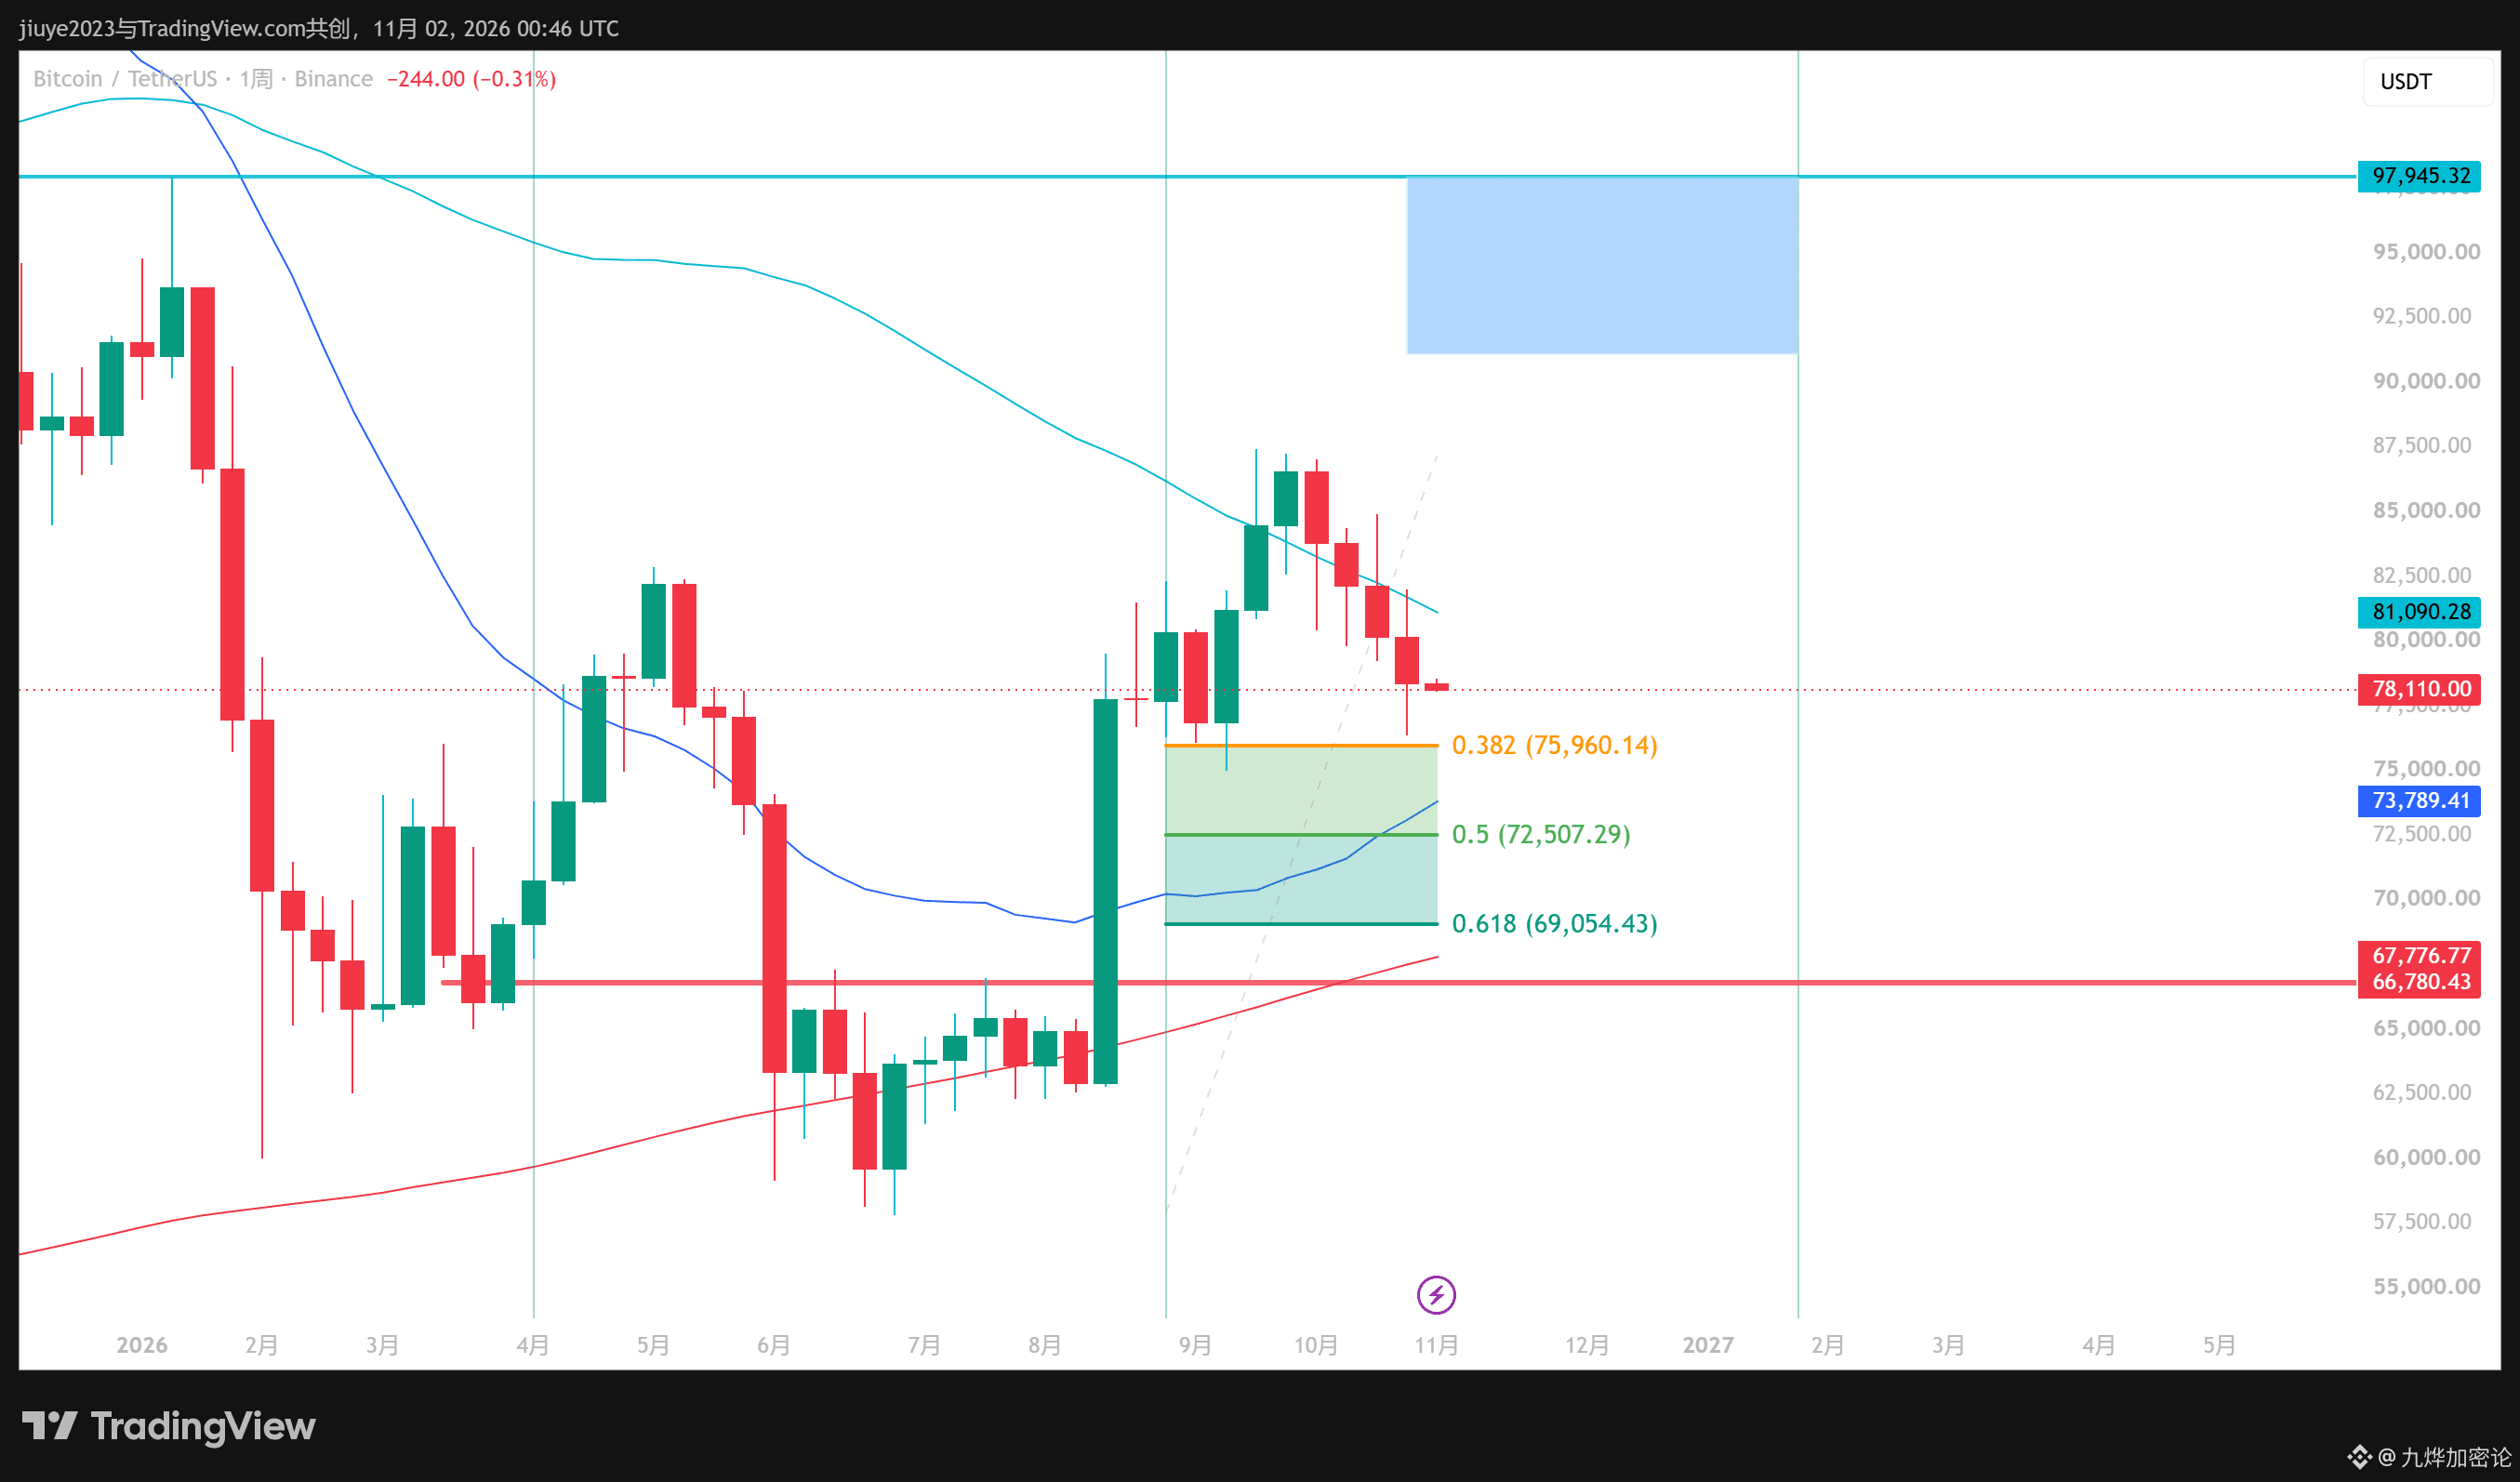
1. BTC touched 76K. The weekly chart shows both upper and lower wicks, but neither is very long. More notably, the small bullish candle’s body is longer than its wicks, which means the decline met resistance, but there’s no clear sign of a bottom yet. Support below: 75K–72K, especially the latter, which is the 61.8% Fibonacci retracement level.
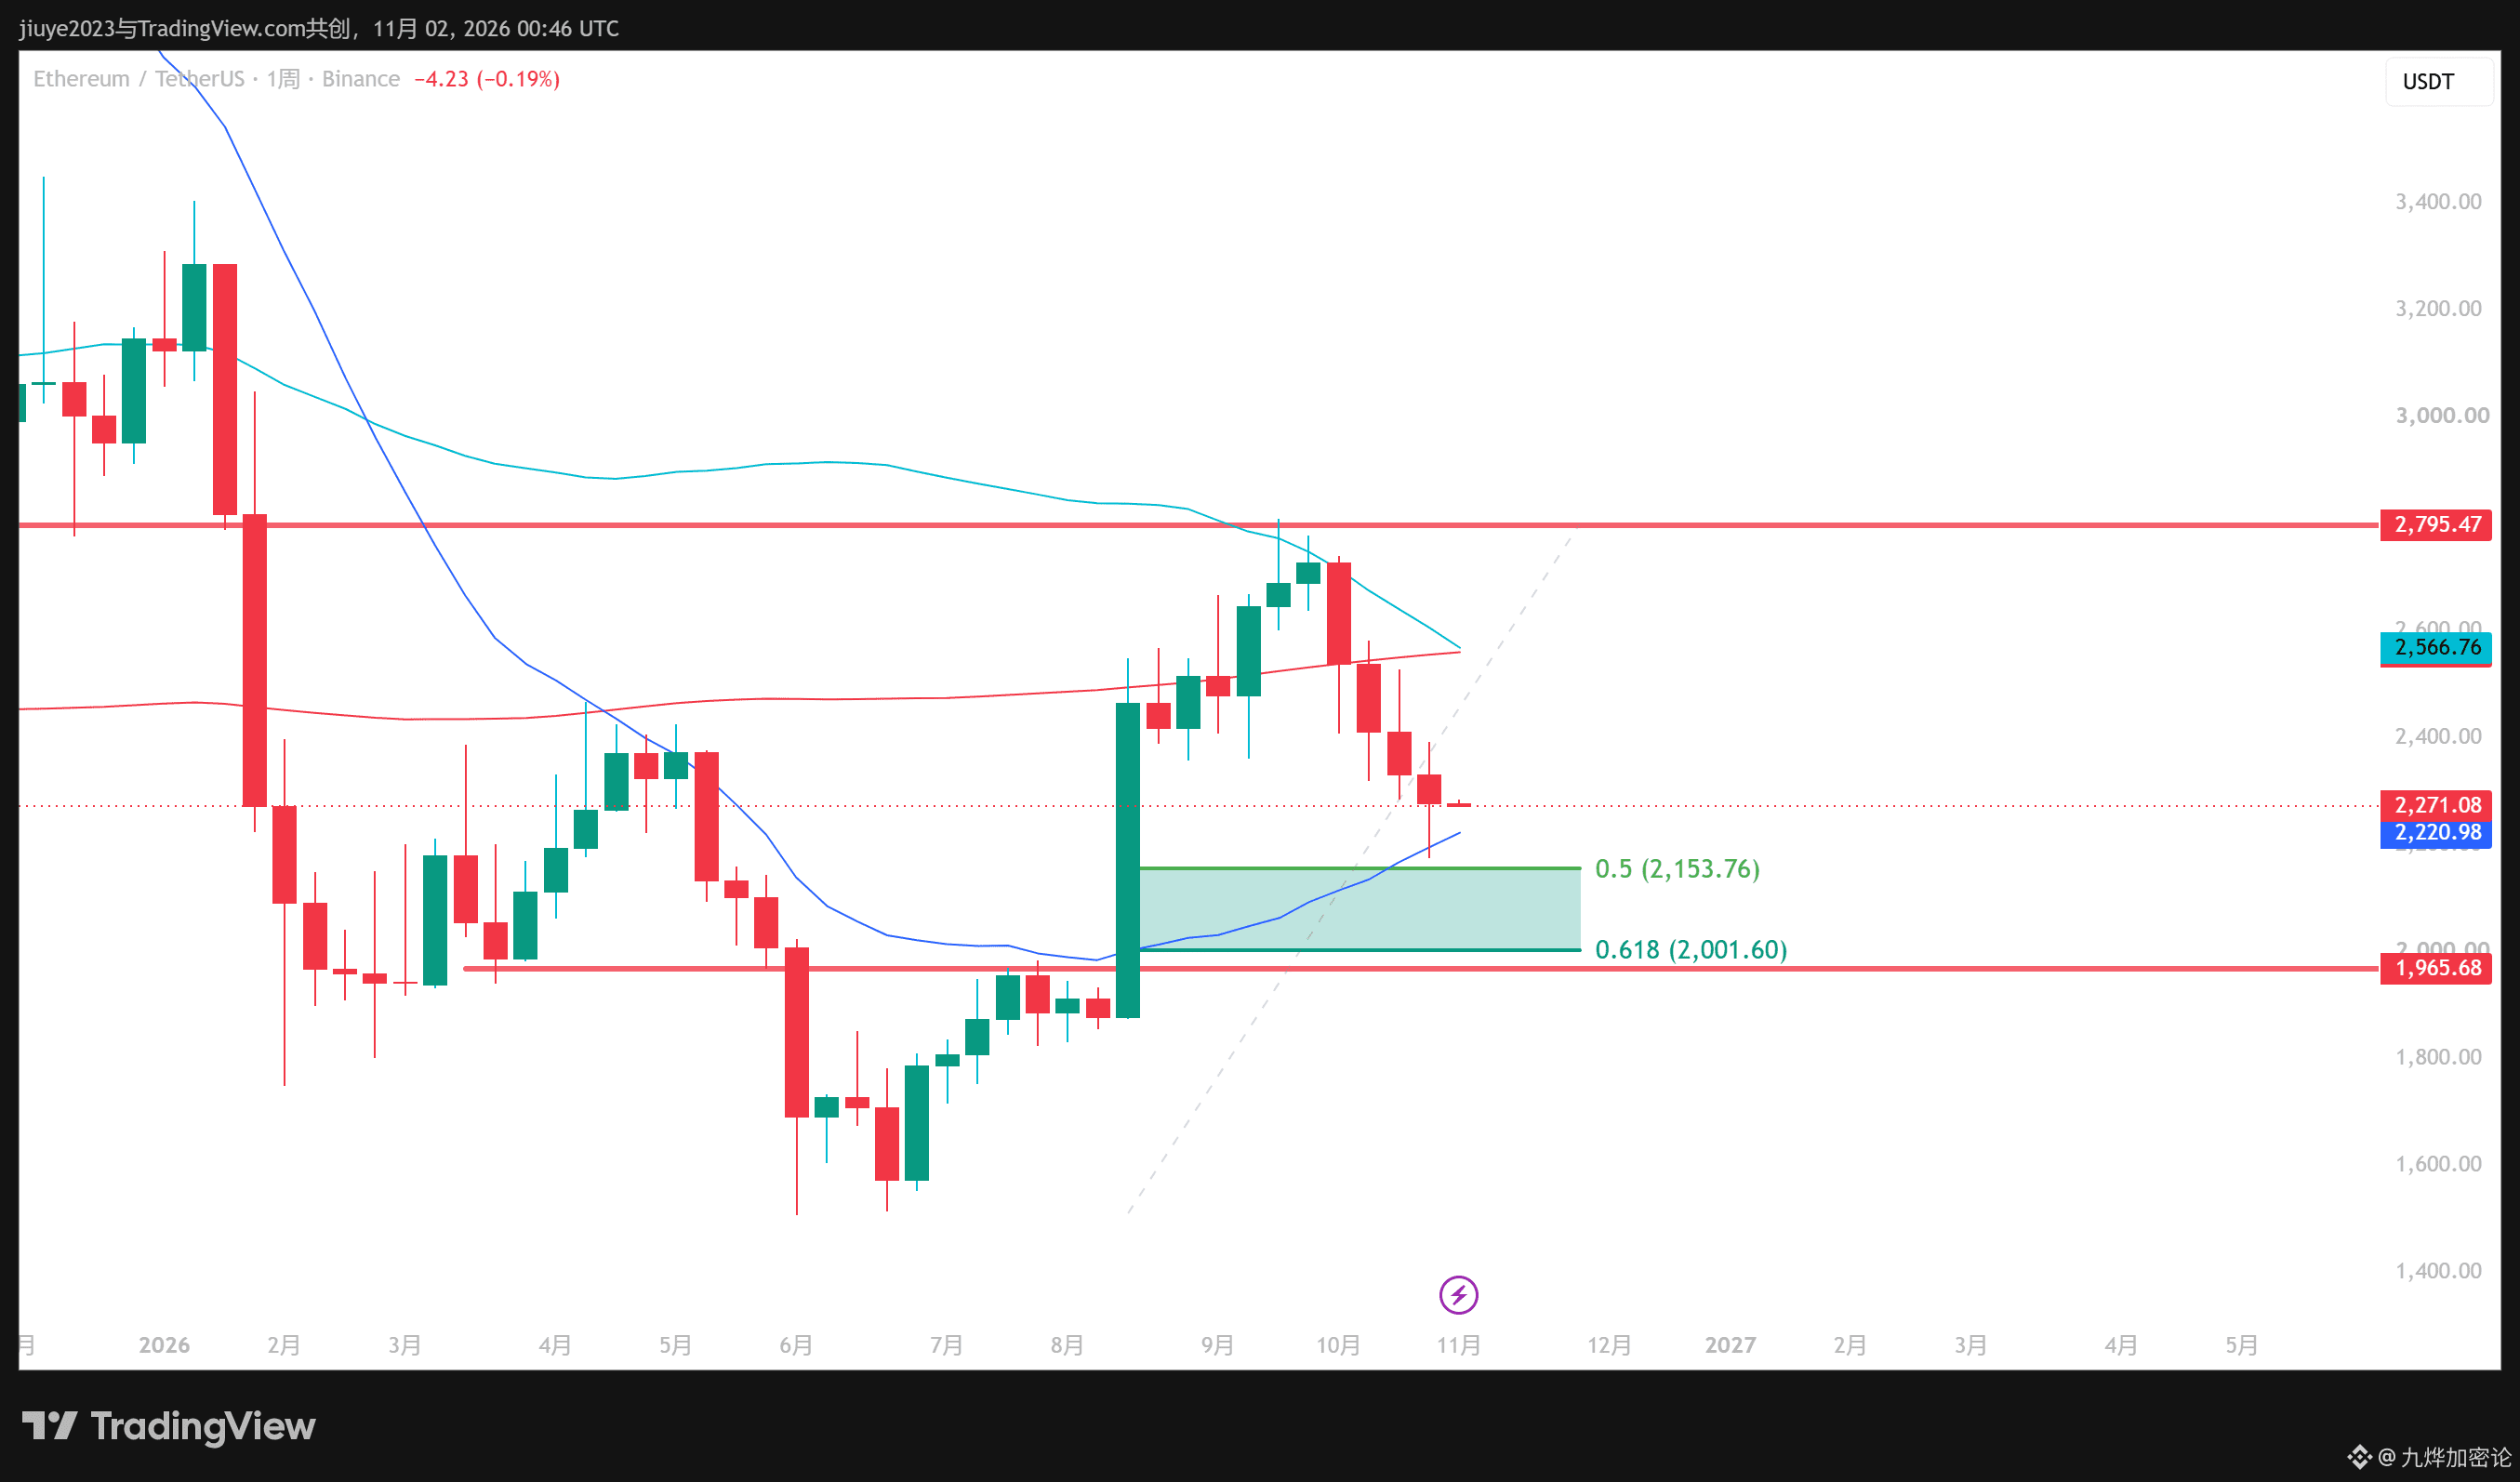
2. ETH has now fallen to its 200-day moving average. The lower wick on the weekly chart is long—in fact, longer than the bearish candle’s body. Ethereum is seeing relatively stronger buying pressure than BTC. Divergence between bulls and bears began to emerge around 2,200, which is also where our buy point came in.
Next, if BTC has further downside to catch up on, Ethereum may test the key support at 2,005U. Last month, our view of the market’s maximum pullback levels was 72K and 2,200U. We’ve now revised that to 72K and 2,000U.
3. Altcoin performance: join the group to see.
$BTC $ETH
1. BTC touched 76K. The weekly chart shows both upper and lower wicks, but neither is very long. More notably, the small bullish candle’s body is longer than its wicks, which means the decline met resistance, but there’s no clear sign of a bottom yet. Support below: 75K–72K, especially the latter, which is the 61.8% Fibonacci retracement level.
2. ETH has now fallen to its 200-day moving average. The lower wick on the weekly chart is long—in fact, longer than the bearish candle’s body. Ethereum is seeing relatively stronger buying pressure than BTC. Divergence between bulls and bears began to emerge around 2,200, which is also where our buy point came in.
Next, if BTC has further downside to catch up on, Ethereum may test the key support at 2,005U. Last month, our view of the market’s maximum pullback levels was 72K and 2,200U. We’ve now revised that to 72K and 2,000U.
3. Altcoin performance: join the group to see.
$BTC $ETH